|
Download Data (XLS File) |
|
||||||||
|
||||||||
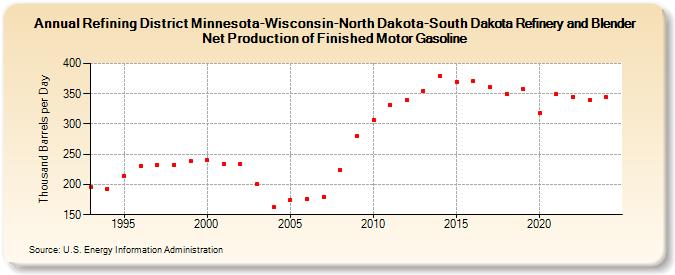
| Refining District Minnesota-Wisconsin-North Dakota-South Dakota Refinery and Blender Net Production of Finished Motor Gasoline (Thousand Barrels per Day) | ||||||||
| Decade | Year-0 | Year-1 | Year-2 | Year-3 | Year-4 | Year-5 | Year-6 | Year-7 | Year-8 | Year-9 |
|---|---|---|---|---|---|---|---|---|---|---|
| 1990's | 195 | 193 | 214 | 231 | 233 | 233 | 239 | |||
| 2000's | 240 | 234 | 234 | 200 | 162 | 175 | 176 | 180 | 224 | 280 |
| 2010's | 306 | 332 | 339 | 355 | 379 | 370 | 371 | 361 | 350 | 358 |
| 2020's | 318 | 349 | 345 | 340 |
| - = No Data Reported; -- = Not Applicable; NA = Not Available; W = Withheld to avoid disclosure of individual company data. |
| Release Date: 6/28/2024 |
| Next Release Date: 8/30/2024 |