|
Download Data (XLS File) |
|
||||||||
|
||||||||
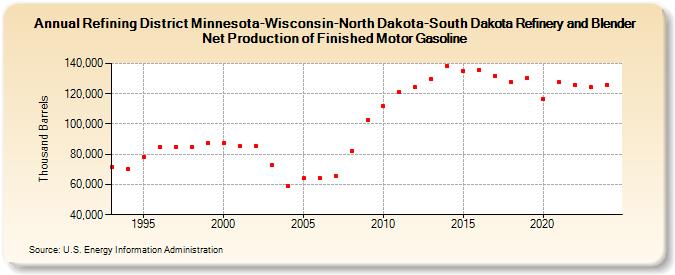
| Refining District Minnesota-Wisconsin-North Dakota-South Dakota Refinery and Blender Net Production of Finished Motor Gasoline (Thousand Barrels) | ||||||||
| Decade | Year-0 | Year-1 | Year-2 | Year-3 | Year-4 | Year-5 | Year-6 | Year-7 | Year-8 | Year-9 |
|---|---|---|---|---|---|---|---|---|---|---|
| 1990's | 71,268 | 70,379 | 78,206 | 84,522 | 84,888 | 84,893 | 87,183 | |||
| 2000's | 87,711 | 85,314 | 85,548 | 72,924 | 59,215 | 64,015 | 64,330 | 65,697 | 82,064 | 102,328 |
| 2010's | 111,577 | 121,019 | 124,202 | 129,600 | 138,233 | 135,060 | 135,854 | 131,900 | 127,685 | 130,718 |
| 2020's | 116,562 | 127,499 | 125,771 | 124,261 |
| - = No Data Reported; -- = Not Applicable; NA = Not Available; W = Withheld to avoid disclosure of individual company data. |
| Release Date: 4/30/2024 |
| Next Release Date: 8/30/2024 |