|
Download Data (XLS File) |
|
||||||||
|
||||||||
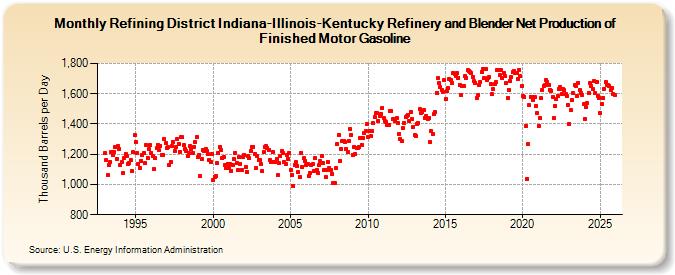
| Refining District Indiana-Illinois-Kentucky Refinery and Blender Net Production of Finished Motor Gasoline (Thousand Barrels per Day) | ||||||||
| Year | Jan | Feb | Mar | Apr | May | Jun | Jul | Aug | Sep | Oct | Nov | Dec |
|---|---|---|---|---|---|---|---|---|---|---|---|---|
| 1993 | 1,205 | 1,160 | 1,060 | 1,128 | 1,148 | 1,216 | 1,196 | 1,217 | 1,249 | 1,170 | 1,253 | 1,232 |
| 1994 | 1,127 | 1,149 | 1,074 | 1,177 | 1,201 | 1,187 | 1,135 | 1,144 | 1,160 | 1,088 | 1,212 | 1,327 |
| 1995 | 1,283 | 1,206 | 1,134 | 1,111 | 1,157 | 1,192 | 1,209 | 1,140 | 1,261 | 1,178 | 1,232 | 1,258 |
| 1996 | 1,209 | 1,186 | 1,101 | 1,177 | 1,240 | 1,264 | 1,226 | 1,257 | 1,196 | 1,198 | 1,300 | 1,274 |
| 1997 | 1,241 | 1,245 | 1,130 | 1,147 | 1,255 | 1,281 | 1,219 | 1,245 | 1,300 | 1,270 | 1,217 | 1,315 |
| 1998 | 1,312 | 1,259 | 1,234 | 1,224 | 1,188 | 1,205 | 1,256 | 1,236 | 1,208 | 1,251 | 1,278 | 1,312 |
| 1999 | 1,181 | 1,195 | 1,054 | 1,166 | 1,231 | 1,222 | 1,232 | 1,218 | 1,202 | 1,165 | 1,151 | 1,202 |
| 2000 | 1,032 | 1,048 | 1,053 | 1,139 | 1,207 | 1,248 | 1,229 | 1,174 | 1,181 | 1,127 | 1,106 | 1,137 |
| 2001 | 1,106 | 1,135 | 1,092 | 1,129 | 1,168 | 1,210 | 1,142 | 1,095 | 1,183 | 1,136 | 1,097 | 1,183 |
| 2002 | 1,194 | 1,118 | 1,085 | 1,189 | 1,172 | 1,220 | 1,248 | 1,250 | 1,203 | 1,106 | 1,191 | 1,161 |
| 2003 | 1,161 | 1,134 | 1,089 | 1,215 | 1,250 | 1,254 | 1,240 | 1,228 | 1,161 | 1,148 | 1,212 | 1,146 |
| 2004 | 1,151 | 1,168 | 1,060 | 1,140 | 1,188 | 1,219 | 1,207 | 1,150 | 1,137 | 1,195 | 1,171 | 1,209 |
| 2005 | 1,094 | 1,065 | 989 | 1,130 | 1,147 | 1,123 | 1,081 | 1,052 | 1,211 | 1,115 | 1,173 | 1,157 |
| 2006 | 1,126 | 1,138 | 1,056 | 1,077 | 1,127 | 1,133 | 1,092 | 1,172 | 1,096 | 1,076 | 1,129 | 1,155 |
| 2007 | 1,187 | 1,140 | 1,094 | 1,048 | 1,098 | 1,148 | 1,110 | 1,096 | 1,071 | 1,007 | 1,009 | 1,107 |
| 2008 | 1,267 | 1,326 | 1,158 | 1,236 | 1,287 | 1,285 | 1,280 | 1,236 | 1,215 | 1,286 | 1,367 | 1,329 |
| 2009 | 1,198 | 1,248 | 1,204 | 1,243 | 1,244 | 1,251 | 1,310 | 1,263 | 1,305 | 1,343 | 1,351 | 1,401 |
| 2010 | 1,314 | 1,351 | 1,321 | 1,351 | 1,405 | 1,447 | 1,470 | 1,472 | 1,420 | 1,454 | 1,467 | 1,508 |
| 2011 | 1,438 | 1,421 | 1,414 | 1,393 | 1,395 | 1,486 | 1,486 | 1,430 | 1,431 | 1,422 | 1,441 | 1,406 |
| 2012 | 1,337 | 1,299 | 1,288 | 1,373 | 1,406 | 1,445 | 1,454 | 1,461 | 1,417 | 1,482 | 1,433 | 1,382 |
| 2013 | 1,327 | 1,322 | 1,400 | 1,408 | 1,497 | 1,474 | 1,476 | 1,490 | 1,437 | 1,456 | 1,435 | 1,438 |
| 2014 | 1,281 | 1,351 | 1,336 | 1,465 | 1,476 | 1,608 | 1,702 | 1,670 | 1,644 | 1,623 | 1,611 | 1,688 |
| 2015 | 1,564 | 1,615 | 1,636 | 1,699 | 1,691 | 1,670 | 1,738 | 1,730 | 1,714 | 1,736 | 1,707 | 1,661 |
| 2016 | 1,594 | 1,653 | 1,652 | 1,717 | 1,706 | 1,755 | 1,749 | 1,746 | 1,735 | 1,712 | 1,681 | 1,673 |
| 2017 | 1,571 | 1,589 | 1,660 | 1,680 | 1,743 | 1,765 | 1,703 | 1,763 | 1,688 | 1,707 | 1,708 | 1,663 |
| 2018 | 1,596 | 1,629 | 1,664 | 1,677 | 1,760 | 1,755 | 1,721 | 1,755 | 1,701 | 1,738 | 1,714 | 1,669 |
| 2019 | 1,575 | 1,627 | 1,685 | 1,711 | 1,741 | 1,749 | 1,739 | 1,739 | 1,697 | 1,757 | 1,717 | 1,652 |
| 2020 | 1,586 | 1,581 | 1,388 | 1,039 | 1,265 | 1,523 | 1,581 | 1,581 | 1,560 | 1,576 | 1,520 | 1,472 |
| 2021 | 1,388 | 1,441 | 1,569 | 1,625 | 1,650 | 1,657 | 1,690 | 1,677 | 1,661 | 1,627 | 1,620 | 1,579 |
| 2022 | 1,439 | 1,521 | 1,564 | 1,584 | 1,630 | 1,645 | 1,600 | 1,631 | 1,624 | 1,596 | 1,584 | 1,524 |
| 2023 | 1,399 | 1,492 | 1,558 | 1,604 | 1,654 | 1,648 | 1,586 | 1,673 | 1,623 | 1,603 | 1,590 | 1,530 |
| 2024 | 1,421 | |||||||||||
| - = No Data Reported; -- = Not Applicable; NA = Not Available; W = Withheld to avoid disclosure of individual company data. |
| Release Date: 3/29/2024 |
| Next Release Date: 4/30/2024 |