|
Download Data (XLS File) |
|
||||||||
|
||||||||
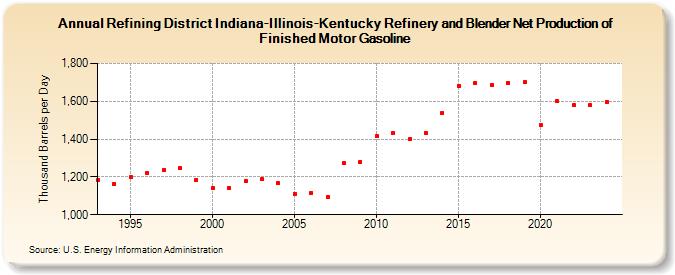
| Refining District Indiana-Illinois-Kentucky Refinery and Blender Net Production of Finished Motor Gasoline (Thousand Barrels per Day) | ||||||||
| Decade | Year-0 | Year-1 | Year-2 | Year-3 | Year-4 | Year-5 | Year-6 | Year-7 | Year-8 | Year-9 |
|---|---|---|---|---|---|---|---|---|---|---|
| 1990's | 1,186 | 1,165 | 1,197 | 1,219 | 1,239 | 1,247 | 1,185 | |||
| 2000's | 1,140 | 1,140 | 1,178 | 1,187 | 1,166 | 1,111 | 1,115 | 1,093 | 1,272 | 1,280 |
| 2010's | 1,416 | 1,430 | 1,398 | 1,431 | 1,539 | 1,680 | 1,698 | 1,687 | 1,699 | 1,700 |
| 2020's | 1,473 | 1,600 | 1,579 | 1,580 |
| - = No Data Reported; -- = Not Applicable; NA = Not Available; W = Withheld to avoid disclosure of individual company data. |
| Release Date: 3/29/2024 |
| Next Release Date: 8/30/2024 |