|
Download Data (XLS File) |
|
||||||||
|
||||||||
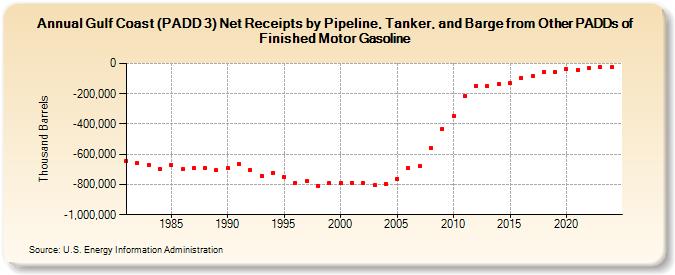
| Gulf Coast (PADD 3) Net Receipts by Pipeline, Tanker, and Barge from Other PADDs of Finished Motor Gasoline (Thousand Barrels) | ||||||||
| Decade | Year-0 | Year-1 | Year-2 | Year-3 | Year-4 | Year-5 | Year-6 | Year-7 | Year-8 | Year-9 |
|---|---|---|---|---|---|---|---|---|---|---|
| 1980's | -645,856 | -658,365 | -671,036 | -700,279 | -672,206 | -700,042 | -691,185 | -688,215 | -705,389 | |
| 1990's | -693,212 | -664,820 | -705,139 | -741,918 | -723,375 | -750,473 | -790,190 | -777,283 | -810,009 | -791,226 |
| 2000's | -790,567 | -789,225 | -793,585 | -805,557 | -793,875 | -761,788 | -693,453 | -680,330 | -560,154 | -433,207 |
| 2010's | -349,125 | -218,271 | -150,066 | -150,496 | -136,227 | -131,105 | -94,309 | -86,006 | -54,775 | -55,411 |
| 2020's | -38,571 | -40,562 | -32,653 | -25,585 |
| - = No Data Reported; -- = Not Applicable; NA = Not Available; W = Withheld to avoid disclosure of individual company data. |
| Release Date: 3/29/2024 |
| Next Release Date: 8/30/2024 |