|
Download Data (XLS File) |
|
||||||||
|
||||||||
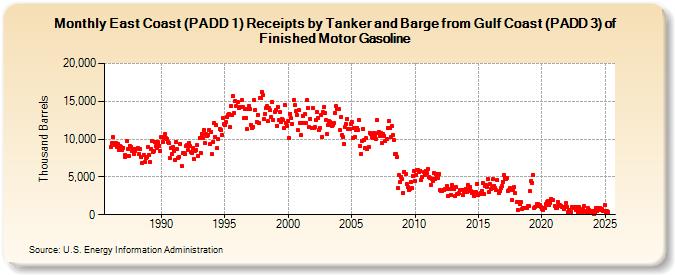
| East Coast (PADD 1) Receipts by Tanker and Barge from Gulf Coast (PADD 3) of Finished Motor Gasoline (Thousand Barrels) | ||||||||
| Year | Jan | Feb | Mar | Apr | May | Jun | Jul | Aug | Sep | Oct | Nov | Dec |
|---|---|---|---|---|---|---|---|---|---|---|---|---|
| 1986 | 8,930 | 9,431 | 10,269 | 9,535 | 9,180 | 9,484 | 8,899 | 9,409 | 8,527 | 9,116 | 8,993 | 8,597 |
| 1987 | 8,857 | 7,835 | 7,656 | 9,697 | 8,715 | 7,800 | 9,138 | 9,002 | 8,383 | 8,756 | 8,056 | 8,436 |
| 1988 | 8,734 | 8,706 | 8,759 | 8,044 | 8,661 | 7,598 | 6,881 | 7,904 | 6,998 | 7,481 | 7,598 | 8,930 |
| 1989 | 7,864 | 6,995 | 8,739 | 9,710 | 8,265 | 8,379 | 9,632 | 9,076 | 8,776 | 9,579 | 9,122 | 8,418 |
| 1990 | 10,330 | 9,667 | 10,156 | 10,627 | 10,098 | 10,024 | 9,659 | 9,512 | 7,464 | 8,831 | 8,037 | 8,925 |
| 1991 | 8,429 | 7,276 | 9,606 | 8,651 | 7,541 | 7,637 | 9,337 | 6,448 | 8,215 | 8,130 | 8,037 | 9,035 |
| 1992 | 9,173 | 8,501 | 9,448 | 9,065 | 8,332 | 8,118 | 8,838 | 7,326 | 8,426 | 8,557 | 9,207 | 7,813 |
| 1993 | 10,112 | 8,202 | 10,740 | 10,136 | 11,235 | 9,531 | 10,705 | 10,454 | 10,499 | 11,252 | 9,305 | 10,993 |
| 1994 | 7,968 | 9,677 | 12,167 | 10,338 | 11,810 | 8,768 | 10,012 | 11,352 | 11,229 | 10,594 | 12,761 | 11,985 |
| 1995 | 11,868 | 12,294 | 12,908 | 13,130 | 13,385 | 11,545 | 14,374 | 13,209 | 15,649 | 13,466 | 15,056 | 14,331 |
| 1996 | 14,881 | 14,174 | 14,304 | 14,263 | 15,147 | 14,268 | 12,759 | 13,946 | 12,835 | 11,326 | 14,008 | 14,345 |
| 1997 | 13,941 | 11,887 | 11,506 | 11,609 | 15,114 | 13,908 | 12,319 | 13,246 | 12,142 | 15,453 | 15,378 | 16,206 |
| 1998 | 15,816 | 12,646 | 13,363 | 14,122 | 14,316 | 12,359 | 14,111 | 13,787 | 12,905 | 14,879 | 12,549 | 13,648 |
| 1999 | 13,830 | 11,740 | 14,309 | 12,463 | 13,540 | 12,303 | 12,650 | 12,578 | 11,423 | 14,466 | 12,093 | 11,713 |
| 2000 | 12,396 | 10,147 | 13,355 | 12,756 | 12,030 | 15,192 | 14,467 | 13,676 | 13,248 | 11,179 | 13,790 | 12,141 |
| 2001 | 10,515 | 12,099 | 13,060 | 12,153 | 13,303 | 12,106 | 15,148 | 14,067 | 11,571 | 12,703 | 11,503 | 14,116 |
| 2002 | 11,516 | 11,567 | 12,563 | 13,637 | 12,823 | 11,140 | 11,490 | 13,182 | 10,341 | 13,533 | 14,259 | 13,426 |
| 2003 | 12,479 | 10,641 | 11,879 | 12,342 | 12,230 | 11,770 | 11,899 | 12,142 | 13,470 | 14,404 | 13,916 | 13,929 |
| 2004 | 13,943 | 11,139 | 12,950 | 10,592 | 10,214 | 9,320 | 11,647 | 11,967 | 12,685 | 11,314 | 11,345 | 12,043 |
| 2005 | 12,316 | 10,118 | 11,478 | 10,343 | 11,174 | 11,533 | 11,233 | 12,493 | 9,136 | 8,017 | 9,728 | 11,370 |
| 2006 | 9,870 | 8,833 | 10,109 | 8,713 | 9,001 | 10,846 | 10,629 | 10,280 | 10,165 | 10,865 | 10,372 | 9,984 |
| 2007 | 12,523 | 10,803 | 10,901 | 10,426 | 10,834 | 9,537 | 10,622 | 10,424 | 9,784 | 9,954 | 11,450 | 12,453 |
| 2008 | 11,466 | 10,242 | 11,720 | 10,590 | 9,864 | 8,008 | 8,002 | 7,602 | 3,530 | 5,203 | 4,335 | 5,034 |
| 2009 | 4,665 | 2,871 | 5,683 | 5,374 | 4,048 | 3,614 | 3,296 | 3,430 | 4,371 | 3,516 | 5,153 | 5,765 |
| 2010 | 4,517 | 5,265 | 5,855 | 5,873 | 5,612 | 5,828 | 4,546 | 5,004 | 5,613 | 5,262 | 5,785 | 5,552 |
| 2011 | 6,056 | 4,934 | 4,891 | 3,944 | 4,756 | 4,404 | 5,522 | 4,729 | 5,353 | 4,955 | 4,920 | 5,438 |
| 2012 | 3,219 | 3,198 | 3,114 | 3,278 | 3,355 | 3,446 | 3,798 | 2,493 | 3,466 | 3,398 | 2,637 | 3,984 |
| 2013 | 3,478 | 3,337 | 2,532 | 3,604 | 2,772 | 2,763 | 2,840 | 3,246 | 3,305 | 2,582 | 2,970 | 3,295 |
| 2014 | 3,448 | 2,982 | 3,944 | 3,293 | 3,716 | 3,085 | 2,875 | 2,938 | 2,464 | 2,960 | 2,989 | 4,124 |
| 2015 | 2,613 | 2,716 | 2,911 | 3,154 | 4,225 | 2,712 | 3,800 | 3,979 | 3,722 | 4,721 | 3,015 | 4,017 |
| 2016 | 3,435 | 3,514 | 4,725 | 3,852 | 3,556 | 3,227 | 4,561 | 2,820 | 3,077 | 3,471 | 3,782 | 4,363 |
| 2017 | 5,208 | 4,831 | 4,674 | 4,898 | 3,150 | 3,260 | 3,535 | 3,439 | 1,931 | 3,285 | 3,603 | 2,808 |
| 2018 | 1,627 | 682 | 1,747 | 1,397 | 1,676 | 711 | 926 | 913 | 905 | 822 | 934 | 1,144 |
| 2019 | 1,120 | 3,085 | 4,495 | 4,200 | 5,300 | 918 | 1,059 | 1,403 | 1,356 | 1,144 | 1,229 | 1,059 |
| 2020 | 745 | 679 | 891 | 848 | 1,472 | 1,665 | 1,811 | 1,299 | 1,586 | 2,141 | 1,981 | 1,897 |
| 2021 | 1,135 | 830 | 830 | 1,738 | 1,335 | 1,227 | 1,168 | 1,071 | 1,040 | 786 | 980 | 1,573 |
| 2022 | 1,072 | 413 | 689 | 432 | 372 | 990 | 915 | 998 | 647 | 987 | 381 | 980 |
| 2023 | 492 | 479 | 414 | 798 | 1,139 | 514 | 415 | 246 | 835 | 584 | 460 | 351 |
| 2024 | 518 | 101 | 266 | 881 | 495 | 833 | ||||||
| - = No Data Reported; -- = Not Applicable; NA = Not Available; W = Withheld to avoid disclosure of individual company data. |
| Release Date: 8/30/2024 |
| Next Release Date: 9/30/2024 |