|
Download Data (XLS File) |
|
||||||||
|
||||||||
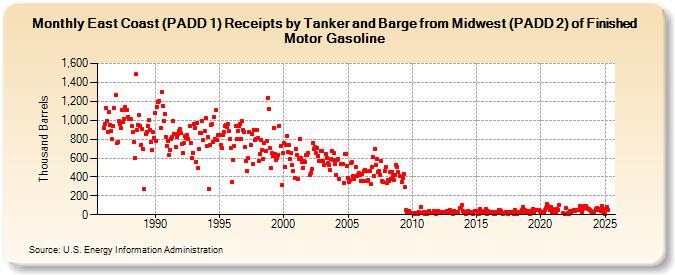
| East Coast (PADD 1) Receipts by Tanker and Barge from Midwest (PADD 2) of Finished Motor Gasoline (Thousand Barrels) | ||||||||
| Year | Jan | Feb | Mar | Apr | May | Jun | Jul | Aug | Sep | Oct | Nov | Dec |
|---|---|---|---|---|---|---|---|---|---|---|---|---|
| 1986 | 916 | 956 | 1,129 | 992 | 880 | 1,089 | 954 | 887 | 801 | 937 | 1,124 | 1,267 |
| 1987 | 757 | 765 | 989 | 956 | 914 | 1,112 | 978 | 1,016 | 1,135 | 1,110 | 1,108 | 1,032 |
| 1988 | 1,017 | 1,016 | 937 | 880 | 768 | 604 | 1,486 | 900 | 949 | 1,052 | 939 | 741 |
| 1989 | 904 | 697 | 267 | 855 | 875 | 937 | 998 | 897 | 774 | 680 | 870 | 815 |
| 1990 | 1,077 | 781 | 1,144 | 1,193 | 1,201 | 919 | 1,302 | 1,152 | 996 | 1,067 | 821 | 730 |
| 1991 | 782 | 636 | 689 | 798 | 827 | 991 | 853 | 716 | 826 | 859 | 884 | 912 |
| 1992 | 861 | 749 | 649 | 758 | 828 | 813 | 841 | 805 | 943 | 764 | 601 | 658 |
| 1993 | 958 | 914 | 558 | 966 | 492 | 699 | 861 | 860 | 987 | 787 | 883 | 1,025 |
| 1994 | 732 | 823 | 274 | 738 | 951 | 960 | 765 | 1,034 | 805 | 1,110 | 793 | 843 |
| 1995 | 840 | 735 | 701 | 846 | 880 | 938 | 945 | 933 | 960 | 886 | 800 | 701 |
| 1996 | 346 | 584 | 725 | 941 | 801 | 888 | 934 | 965 | 800 | 990 | 895 | 877 |
| 1997 | 717 | 572 | 463 | 595 | 876 | 741 | 850 | 533 | 900 | 792 | 796 | 892 |
| 1998 | 808 | 573 | 647 | 790 | 685 | 594 | 754 | 670 | 782 | 1,238 | 1,117 | 704 |
| 1999 | 499 | 648 | 620 | 922 | 639 | 577 | 595 | 633 | 940 | 729 | 318 | 652 |
| 2000 | 761 | 503 | 735 | 836 | 664 | 736 | 593 | 649 | 526 | 465 | 393 | 700 |
| 2001 | 631 | 380 | 591 | 796 | 604 | 554 | 499 | 564 | 554 | 630 | 631 | 654 |
| 2002 | 415 | 441 | 484 | 764 | 694 | 721 | 657 | 710 | 623 | 567 | 563 | 669 |
| 2003 | 674 | 569 | 528 | 644 | 596 | 544 | 525 | 477 | 588 | 672 | 578 | 648 |
| 2004 | 540 | 421 | 584 | 594 | 382 | 534 | 536 | 539 | 339 | 643 | 646 | 515 |
| 2005 | 389 | 348 | 362 | 543 | 555 | 405 | 376 | 508 | 412 | 418 | 440 | 418 |
| 2006 | 359 | 426 | 359 | 460 | 475 | 460 | 361 | 365 | 461 | 321 | 500 | 606 |
| 2007 | 414 | 690 | 529 | 588 | 450 | 464 | 421 | 564 | 356 | 349 | 458 | 507 |
| 2008 | 331 | 364 | 352 | 455 | 376 | 450 | 407 | 363 | 422 | 527 | 508 | 451 |
| 2009 | 409 | 346 | 392 | 434 | 289 | 45 | 13 | 20 | 36 | 20 | 22 | |
| 2010 | 13 | 12 | 21 | 18 | 12 | 28 | 18 | 84 | 13 | 16 | 33 | |
| 2011 | 11 | 10 | 33 | 44 | 21 | 19 | 39 | 22 | 12 | 14 | ||
| 2012 | 35 | 14 | 34 | 32 | 31 | 21 | 41 | 28 | 23 | 49 | ||
| 2013 | 27 | 32 | 11 | 42 | 25 | 17 | 31 | 33 | 73 | 73 | 106 | 44 |
| 2014 | 22 | 32 | 10 | 23 | 41 | 18 | 21 | 32 | 18 | 8 | 43 | 38 |
| 2015 | 40 | 18 | 10 | 59 | 38 | 31 | 27 | 38 | 61 | 7 | 42 | |
| 2016 | 26 | 22 | 31 | 31 | 7 | 8 | 34 | 24 | 14 | 50 | 47 | 40 |
| 2017 | 23 | 4 | 21 | 33 | 27 | 11 | 26 | 27 | 26 | 20 | 30 | 8 |
| 2018 | 47 | 8 | 5 | 19 | 34 | 25 | 47 | 81 | 23 | 45 | 26 | 33 |
| 2019 | 38 | 33 | 9 | 40 | 26 | 64 | 17 | 49 | 48 | 55 | 51 | 40 |
| 2020 | 16 | 22 | 33 | 29 | 47 | 68 | 109 | 90 | 48 | 79 | 23 | 56 |
| 2021 | 28 | 26 | 27 | 61 | 52 | 101 | 20 | 12 | 73 | |||
| 2022 | 23 | 10 | 39 | 20 | 40 | 43 | 46 | 41 | 54 | 54 | 51 | |
| 2023 | 90 | 48 | 30 | 60 | 97 | 69 | 89 | 71 | 57 | 61 | 48 | 44 |
| 2024 | 28 | |||||||||||
| - = No Data Reported; -- = Not Applicable; NA = Not Available; W = Withheld to avoid disclosure of individual company data. |
| Release Date: 3/29/2024 |
| Next Release Date: 4/30/2024 |