|
Download Data (XLS File) |
|
||||||||
|
||||||||
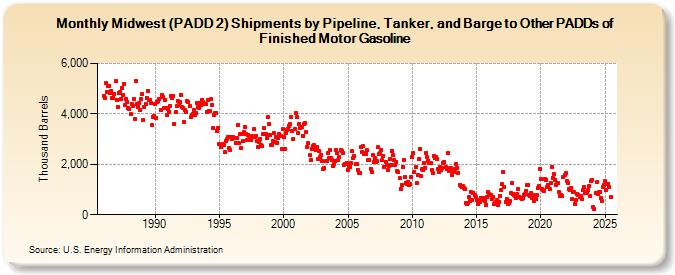
| Midwest (PADD 2) Shipments by Pipeline, Tanker, and Barge to Other PADDs of Finished Motor Gasoline (Thousand Barrels) | ||||||||
| Year | Jan | Feb | Mar | Apr | May | Jun | Jul | Aug | Sep | Oct | Nov | Dec |
|---|---|---|---|---|---|---|---|---|---|---|---|---|
| 1986 | 4,724 | 4,649 | 5,212 | 4,880 | 5,122 | 5,118 | 4,823 | 4,927 | 4,639 | 4,645 | 4,792 | 5,311 |
| 1987 | 4,563 | 4,289 | 4,823 | 4,872 | 4,605 | 5,028 | 4,758 | 5,201 | 4,371 | 4,604 | 4,462 | 4,253 |
| 1988 | 4,199 | 3,984 | 4,388 | 4,331 | 4,595 | 3,794 | 5,324 | 4,406 | 4,281 | 4,434 | 4,136 | 4,597 |
| 1989 | 4,786 | 3,750 | 4,287 | 4,385 | 4,648 | 4,921 | 4,550 | 4,560 | 4,445 | 3,563 | 3,879 | 3,912 |
| 1990 | 4,376 | 3,846 | 4,470 | 4,497 | 4,597 | 4,171 | 4,754 | 4,659 | 4,221 | 4,548 | 4,234 | 3,942 |
| 1991 | 4,175 | 4,084 | 4,323 | 4,715 | 4,647 | 4,728 | 3,599 | 4,072 | 4,294 | 4,505 | 4,359 | 4,462 |
| 1992 | 4,754 | 4,281 | 4,225 | 3,696 | 4,160 | 4,074 | 4,500 | 4,483 | 4,309 | 3,886 | 3,965 | 4,013 |
| 1993 | 4,173 | 3,947 | 4,040 | 4,440 | 4,264 | 4,249 | 4,425 | 4,362 | 4,567 | 4,464 | 4,402 | 4,390 |
| 1994 | 4,089 | 4,534 | 4,127 | 4,118 | 4,576 | 4,361 | 3,428 | 3,965 | 4,045 | 4,022 | 3,333 | 3,433 |
| 1995 | 2,786 | 2,691 | 2,753 | 2,813 | 2,748 | 2,480 | 2,936 | 3,010 | 3,095 | 2,638 | 2,587 | 3,081 |
| 1996 | 3,001 | 3,091 | 3,041 | 2,864 | 3,024 | 3,563 | 2,829 | 3,192 | 2,641 | 3,217 | 2,932 | 3,275 |
| 1997 | 3,488 | 3,204 | 2,968 | 3,168 | 3,009 | 2,971 | 3,107 | 3,070 | 3,404 | 3,094 | 3,132 | 2,927 |
| 1998 | 2,683 | 2,892 | 2,987 | 2,773 | 2,716 | 3,195 | 3,425 | 3,198 | 3,039 | 3,866 | 3,604 | 3,180 |
| 1999 | 2,762 | 2,774 | 2,924 | 3,238 | 2,893 | 3,097 | 2,856 | 3,036 | 3,195 | 3,104 | 2,607 | 3,386 |
| 2000 | 3,065 | 2,621 | 3,235 | 3,378 | 3,392 | 3,508 | 3,595 | 3,880 | 3,309 | 3,004 | 3,394 | 4,046 |
| 2001 | 3,872 | 3,250 | 3,597 | 3,437 | 3,492 | 3,466 | 3,136 | 3,587 | 3,645 | 3,276 | 2,695 | 2,828 |
| 2002 | 2,358 | 2,178 | 2,618 | 2,718 | 2,757 | 2,678 | 2,585 | 2,706 | 2,202 | 2,526 | 2,275 | 2,380 |
| 2003 | 2,114 | 1,818 | 1,864 | 2,115 | 2,115 | 2,452 | 2,233 | 2,558 | 2,258 | 2,162 | 1,922 | 2,003 |
| 2004 | 2,140 | 2,586 | 2,443 | 2,185 | 2,274 | 2,576 | 2,540 | 2,440 | 1,982 | 2,020 | 2,012 | 2,070 |
| 2005 | 1,788 | 1,911 | 1,907 | 2,037 | 2,509 | 2,260 | 2,310 | 1,999 | 2,005 | 1,793 | 1,663 | 1,647 |
| 2006 | 2,674 | 2,494 | 2,708 | 2,418 | 2,463 | 2,419 | 2,550 | 2,156 | 2,190 | 1,827 | 1,707 | 2,355 |
| 2007 | 2,088 | 2,233 | 2,089 | 2,120 | 2,675 | 2,390 | 2,432 | 2,568 | 2,167 | 2,337 | 1,901 | 2,107 |
| 2008 | 1,955 | 1,777 | 1,943 | 2,198 | 1,973 | 2,540 | 2,352 | 2,157 | 1,955 | 2,101 | 1,751 | 1,701 |
| 2009 | 1,451 | 1,011 | 1,174 | 1,890 | 2,190 | 1,484 | 1,268 | 1,222 | 1,286 | 1,166 | 1,205 | 1,491 |
| 2010 | 2,300 | 2,436 | 1,700 | 1,890 | 1,250 | 1,566 | 2,200 | 2,624 | 1,529 | 1,820 | 1,781 | 2,066 |
| 2011 | 1,865 | 2,465 | 2,280 | 2,149 | 2,040 | 2,061 | 1,780 | 1,644 | 2,349 | 2,266 | 2,299 | 2,204 |
| 2012 | 1,824 | 1,689 | 1,910 | 1,778 | 1,853 | 2,034 | 2,082 | 1,891 | 1,820 | 2,435 | 1,717 | 1,838 |
| 2013 | 1,864 | 1,581 | 1,751 | 1,694 | 1,808 | 2,017 | 1,872 | 1,647 | 1,196 | 1,150 | 1,092 | 1,127 |
| 2014 | 1,051 | 1,033 | 473 | 415 | 465 | 700 | 556 | 882 | 583 | 878 | 768 | 711 |
| 2015 | 564 | 420 | 556 | 498 | 670 | 612 | 571 | 653 | 552 | 398 | 699 | 891 |
| 2016 | 841 | 794 | 630 | 704 | 411 | 447 | 501 | 573 | 385 | 510 | 755 | 997 |
| 2017 | 1,205 | 1,696 | 1,098 | 523 | 627 | 419 | 462 | 533 | 853 | 1,242 | 823 | 772 |
| 2018 | 741 | 678 | 824 | 1,005 | 719 | 677 | 640 | 659 | 800 | 818 | 953 | 1,160 |
| 2019 | 1,192 | 793 | 754 | 852 | 668 | 779 | 533 | 625 | 764 | 1,070 | 1,126 | 1,825 |
| 2020 | 1,428 | 1,031 | 965 | 940 | 1,433 | 1,396 | 1,092 | 1,169 | 1,002 | 1,260 | 1,903 | 1,459 |
| 2021 | 1,619 | 1,385 | 1,192 | 1,253 | 1,251 | 889 | 760 | 769 | 755 | 1,503 | 1,563 | 1,653 |
| 2022 | 1,350 | 1,244 | 1,028 | 984 | 1,044 | 623 | 909 | 883 | 430 | 585 | 840 | 776 |
| 2023 | 705 | 759 | 643 | 990 | 1,103 | 852 | 877 | 901 | 980 | 1,132 | 742 | 1,343 |
| 2024 | 1,393 | |||||||||||
| - = No Data Reported; -- = Not Applicable; NA = Not Available; W = Withheld to avoid disclosure of individual company data. |
| Release Date: 3/29/2024 |
| Next Release Date: 4/30/2024 |