|
Download Data (XLS File) |
|
||||||||
|
||||||||
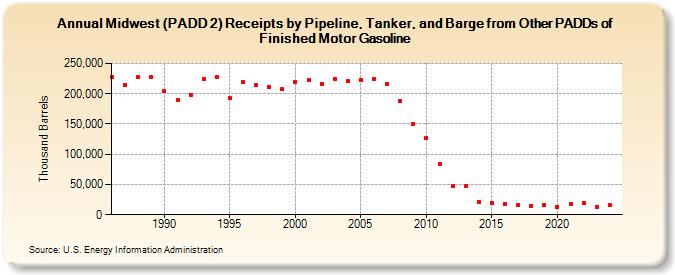
| Midwest (PADD 2) Receipts by Pipeline, Tanker, and Barge from Other PADDs of Finished Motor Gasoline (Thousand Barrels) | ||||||||
| Decade | Year-0 | Year-1 | Year-2 | Year-3 | Year-4 | Year-5 | Year-6 | Year-7 | Year-8 | Year-9 |
|---|---|---|---|---|---|---|---|---|---|---|
| 1980's | 227,885 | 214,532 | 227,607 | 227,173 | ||||||
| 1990's | 203,973 | 189,775 | 198,467 | 224,280 | 226,832 | 192,878 | 218,583 | 213,718 | 210,402 | 207,407 |
| 2000's | 219,669 | 222,477 | 216,628 | 224,543 | 221,304 | 222,409 | 224,234 | 216,435 | 188,798 | 150,114 |
| 2010's | 126,842 | 83,994 | 47,639 | 46,933 | 20,809 | 19,983 | 17,875 | 15,297 | 14,190 | 15,905 |
| 2020's | 12,474 | 17,370 | 18,665 | 13,294 |
| - = No Data Reported; -- = Not Applicable; NA = Not Available; W = Withheld to avoid disclosure of individual company data. |
| Release Date: 3/29/2024 |
| Next Release Date: 8/30/2024 |