|
Download Data (XLS File) |
|
||||||||
|
||||||||
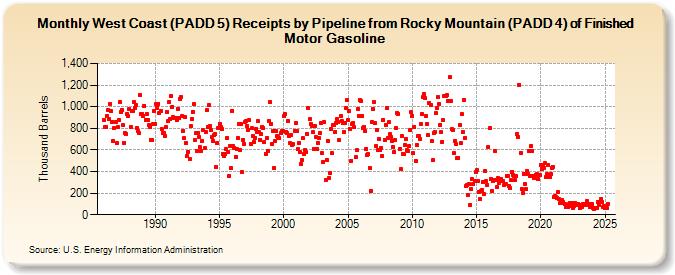
| West Coast (PADD 5) Receipts by Pipeline from Rocky Mountain (PADD 4) of Finished Motor Gasoline (Thousand Barrels) | ||||||||
| Year | Jan | Feb | Mar | Apr | May | Jun | Jul | Aug | Sep | Oct | Nov | Dec |
|---|---|---|---|---|---|---|---|---|---|---|---|---|
| 1986 | 875 | 810 | 816 | 914 | 971 | 884 | 1,029 | 956 | 862 | 683 | 806 | 857 |
| 1987 | 660 | 810 | 877 | 1,041 | 950 | 972 | 827 | 667 | 758 | 748 | 933 | 914 |
| 1988 | 976 | 815 | 956 | 956 | 1,042 | 992 | 1,019 | 803 | 772 | 753 | 1,110 | 935 |
| 1989 | 933 | 914 | 1,011 | 876 | 933 | 876 | 827 | 814 | 693 | 690 | 837 | 963 |
| 1990 | 843 | 1,029 | 990 | 1,029 | 940 | 960 | 794 | 761 | 754 | 728 | 811 | 953 |
| 1991 | 863 | 1,044 | 889 | 1,098 | 1,001 | 901 | 898 | 893 | 879 | 981 | 899 | 1,073 |
| 1992 | 1,089 | 913 | 777 | 709 | 902 | 662 | 539 | 585 | 514 | 819 | 887 | 955 |
| 1993 | 1,023 | 688 | 752 | 586 | 757 | 718 | 623 | 587 | 685 | 781 | 614 | 768 |
| 1994 | 967 | 814 | 1,014 | 822 | 787 | 722 | 682 | 734 | 750 | 438 | 666 | 803 |
| 1995 | 842 | 812 | 795 | 564 | 548 | 566 | 605 | 709 | 578 | 356 | 636 | 432 |
| 1996 | 964 | 635 | 618 | 537 | 610 | 711 | 839 | 600 | 838 | 395 | 696 | 656 |
| 1997 | 860 | 872 | 819 | 787 | 873 | 651 | 800 | 732 | 675 | 713 | 798 | 768 |
| 1998 | 863 | 762 | 694 | 745 | 812 | 802 | 672 | 565 | 708 | 592 | 864 | 1,042 |
| 1999 | 842 | 650 | 778 | 435 | 687 | 777 | 727 | 721 | 706 | 752 | 771 | 776 |
| 2000 | 910 | 934 | 769 | 760 | 872 | 725 | 663 | 739 | 649 | 651 | 779 | 847 |
| 2001 | 776 | 607 | 664 | 578 | 469 | 505 | 706 | 559 | 602 | 577 | 749 | 986 |
| 2002 | 883 | 839 | 817 | 762 | 611 | 824 | 717 | 607 | 668 | 710 | 757 | 850 |
| 2003 | 570 | 490 | 859 | 322 | 510 | 682 | 338 | 383 | 794 | 568 | 831 | 828 |
| 2004 | 767 | 851 | 889 | 861 | 689 | 914 | 872 | 846 | 764 | 852 | 987 | 1,059 |
| 2005 | 880 | 958 | 795 | 498 | 844 | 850 | 808 | 531 | 599 | 981 | 911 | 1,065 |
| 2006 | 1,049 | 912 | 806 | 816 | 777 | 610 | 549 | 561 | 435 | 223 | 859 | 979 |
| 2007 | 1,044 | 848 | 632 | 783 | 601 | 704 | 595 | 615 | 546 | 877 | 696 | 832 |
| 2008 | 989 | 709 | 855 | 744 | 724 | 686 | 631 | 579 | 696 | 802 | 938 | 934 |
| 2009 | 609 | 422 | 727 | 561 | 558 | 648 | 700 | 598 | 586 | 638 | 785 | 948 |
| 2010 | 918 | 569 | 812 | 501 | 646 | 728 | 727 | 703 | 837 | 932 | 1,088 | 1,117 |
| 2011 | 1,078 | 910 | 842 | 734 | 1,033 | 1,013 | 683 | 502 | 758 | 766 | 938 | 988 |
| 2012 | 1,089 | 1,029 | 834 | 765 | 677 | 873 | 1,098 | 1,102 | 1,107 | 1,054 | 1,055 | 1,272 |
| 2013 | 1,055 | 789 | 783 | 567 | 685 | 650 | 521 | 529 | 831 | 661 | 930 | 769 |
| 2014 | 1,063 | 712 | 265 | 273 | 178 | 281 | 91 | 237 | 326 | 283 | 313 | 394 |
| 2015 | 412 | 310 | 214 | 143 | 220 | 229 | 305 | 190 | 409 | 308 | 278 | 624 |
| 2016 | 800 | 330 | 220 | 315 | 321 | 589 | 320 | 253 | 338 | 298 | 331 | 334 |
| 2017 | 313 | 309 | 272 | 285 | 362 | 356 | 265 | 245 | 322 | 400 | 371 | 356 |
| 2018 | 320 | 355 | 749 | 721 | 1,203 | 573 | 239 | 202 | 381 | 286 | 236 | 406 |
| 2019 | 380 | 588 | 359 | 638 | 590 | 358 | 342 | 370 | 376 | 333 | 364 | 372 |
| 2020 | 461 | 421 | 459 | 433 | 475 | 346 | 373 | 463 | 348 | 374 | 432 | 446 |
| 2021 | 166 | 172 | 167 | 155 | 209 | 142 | 105 | 105 | 136 | 117 | 97 | 71 |
| 2022 | 83 | 68 | 96 | 108 | 79 | 104 | 65 | 81 | 109 | 92 | 86 | 100 |
| 2023 | 59 | 86 | 75 | 101 | 102 | 87 | 91 | 124 | 103 | 95 | 67 | 84 |
| 2024 | 95 | 65 | 51 | 61 | 61 | 117 | 90 | 119 | 144 | 117 | 71 | 83 |
| 2025 | 64 | 66 | 58 | 101 | ||||||||
| - = No Data Reported; -- = Not Applicable; NA = Not Available; W = Withheld to avoid disclosure of individual company data. |
| Release Date: 6/30/2025 |
| Next Release Date: 7/31/2025 |