|
Download Data (XLS File) |
|
||||||||
|
||||||||
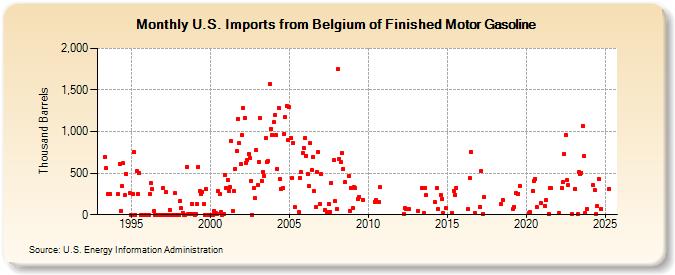
| U.S. Imports from Belgium of Finished Motor Gasoline (Thousand Barrels) | ||||||||
| Year | Jan | Feb | Mar | Apr | May | Jun | Jul | Aug | Sep | Oct | Nov | Dec |
|---|---|---|---|---|---|---|---|---|---|---|---|---|
| 1993 | 690 | 556 | 251 | 248 | ||||||||
| 1994 | 244 | 611 | 45 | 344 | 616 | 233 | 493 | 258 | ||||
| 1995 | 0 | 245 | 754 | 0 | 522 | 254 | 503 | 0 | 0 | 0 | 0 | 0 |
| 1996 | 0 | 0 | 254 | 377 | 307 | 41 | 0 | 0 | 0 | 0 | 0 | 0 |
| 1997 | 320 | 0 | 272 | 0 | 0 | 62 | 0 | 0 | 0 | 257 | 0 | 0 |
| 1998 | 0 | 170 | 76 | 23 | 0 | 0 | 577 | 9 | 3 | 6 | 130 | 3 |
| 1999 | 0 | 8 | 131 | 578 | 280 | 247 | 279 | 125 | 0 | 305 | 0 | 0 |
| 2000 | 0 | 0 | 0 | 46 | 26 | 5 | 284 | 247 | 33 | 0 | 9 | 478 |
| 2001 | 326 | 423 | 286 | 333 | 881 | 45 | 285 | 555 | 762 | 1,153 | 861 | 604 |
| 2002 | 958 | 1,285 | 1,165 | 625 | 658 | 730 | 676 | 408 | 0 | 324 | 200 | 777 |
| 2003 | 356 | 637 | 1,164 | 411 | 516 | 460 | 921 | 636 | 647 | 1,570 | 1,035 | 964 |
| 2004 | 1,113 | 1,203 | 960 | 552 | 1,289 | 424 | 313 | 320 | 973 | 1,174 | 1,313 | 893 |
| 2005 | 1,298 | 918 | 438 | 860 | 92 | 29 | 444 | 512 | 747 | 804 | ||
| 2006 | 924 | 712 | 494 | 347 | 857 | 539 | 696 | 282 | 88 | 518 | 753 | 125 |
| 2007 | 484 | 56 | 31 | 127 | 35 | 387 | 656 | 161 | ||||
| 2008 | 72 | 1,748 | 671 | 634 | 741 | 555 | 390 | 464 | 50 | 325 | ||
| 2009 | 80 | 329 | 323 | 185 | 219 | 180 | ||||||
| 2010 | 158 | 173 | 150 | 328 | ||||||||
| 2012 | 14 | 80 | 65 | 66 | ||||||||
| 2013 | 48 | 317 | 20 | 326 | 234 | |||||||
| 2014 | 148 | 325 | 63 | 233 | 191 | 16 | 75 | |||||
| 2015 | 23 | 282 | 241 | 327 | ||||||||
| 2016 | 68 | 436 | 760 | 24 | ||||||||
| 2017 | 95 | 525 | 6 | 211 | ||||||||
| 2018 | 127 | 179 | ||||||||||
| 2019 | 70 | 96 | 258 | 255 | 347 | |||||||
| 2020 | 17 | 34 | 285 | 403 | 427 | 95 | 140 | |||||
| 2021 | 106 | 171 | 10 | 318 | 318 | |||||||
| 2022 | 15 | 321 | 393 | 733 | 964 | 414 | 359 | 8 | ||||
| 2023 | 315 | 4 | 510 | 484 | 506 | 1,068 | 686 | 23 | 71 | |||
| - = No Data Reported; -- = Not Applicable; NA = Not Available; W = Withheld to avoid disclosure of individual company data. |
| Release Date: 3/29/2024 |
| Next Release Date: 4/30/2024 |