|
Download Data (XLS File) |
|
||||||||
|
||||||||
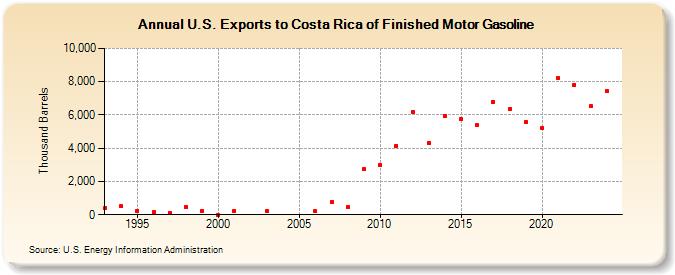
| U.S. Exports to Costa Rica of Finished Motor Gasoline (Thousand Barrels) | ||||||||
| Decade | Year-0 | Year-1 | Year-2 | Year-3 | Year-4 | Year-5 | Year-6 | Year-7 | Year-8 | Year-9 |
|---|---|---|---|---|---|---|---|---|---|---|
| 1990's | 392 | 507 | 251 | 154 | 126 | 474 | 240 | |||
| 2000's | 0 | 245 | 218 | 197 | 780 | 465 | 2,726 | |||
| 2010's | 3,000 | 4,152 | 6,177 | 4,308 | 5,932 | 5,728 | 5,376 | 6,802 | 6,370 | 5,599 |
| 2020's | 5,212 | 8,229 | 7,822 | 7,462 |
| - = No Data Reported; -- = Not Applicable; NA = Not Available; W = Withheld to avoid disclosure of individual company data. |
| Release Date: 6/28/2024 |
| Next Release Date: 8/30/2024 |