|
Download Data (XLS File) |
|
||||||||
|
||||||||
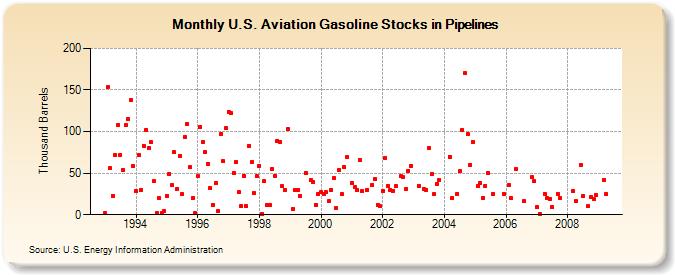
| U.S. Aviation Gasoline Stocks in Pipelines (Thousand Barrels) | ||||||||
| Year | Jan | Feb | Mar | Apr | May | Jun | Jul | Aug | Sep | Oct | Nov | Dec |
|---|---|---|---|---|---|---|---|---|---|---|---|---|
| 1993 | 2 | 153 | 56 | 23 | 72 | 108 | 72 | 54 | 108 | 115 | 138 | 58 |
| 1994 | 28 | 72 | 30 | 83 | 102 | 80 | 87 | 40 | 2 | 20 | 2 | 4 |
| 1995 | 23 | 49 | 36 | 75 | 31 | 71 | 25 | 94 | 109 | 57 | 20 | 2 |
| 1996 | 46 | 106 | 87 | 75 | 61 | 32 | 12 | 38 | 4 | 97 | 64 | 104 |
| 1997 | 124 | 122 | 50 | 63 | 27 | 10 | 47 | 10 | 83 | 63 | 26 | 46 |
| 1998 | 59 | 1 | 40 | 12 | 12 | 55 | 47 | 89 | 88 | 34 | 30 | 103 |
| 1999 | 7 | 30 | 30 | 23 | 50 | 42 | 39 | 12 | 25 | |||
| 2000 | 27 | 25 | 27 | 16 | 30 | 44 | 8 | 54 | 25 | 57 | 69 | |
| 2001 | 38 | 33 | 30 | 66 | 28 | 30 | 36 | 43 | 12 | 10 | ||
| 2002 | 29 | 68 | 35 | 30 | 29 | 34 | 46 | 45 | 31 | 53 | 59 | |
| 2003 | 35 | 31 | 30 | 80 | 49 | 25 | 37 | 42 | ||||
| 2004 | 70 | 20 | 25 | 52 | 102 | 170 | 97 | 60 | 88 | |||
| 2005 | 35 | 38 | 20 | 35 | 50 | 25 | 25 | |||||
| 2006 | 36 | 20 | 55 | 16 | 45 | 40 | ||||||
| 2007 | 9 | 1 | 25 | 20 | 19 | 9 | 25 | 20 | ||||
| 2008 | 28 | 16 | 60 | 23 | 10 | 21 | 19 | 24 | ||||
| 2009 | 42 | 25 | ||||||||||
| - = No Data Reported; -- = Not Applicable; NA = Not Available; W = Withheld to avoid disclosure of individual company data. |
| Release Date: 3/29/2024 |
| Next Release Date: 4/30/2024 |