|
Download Data (XLS File) |
|
||||||||
|
||||||||
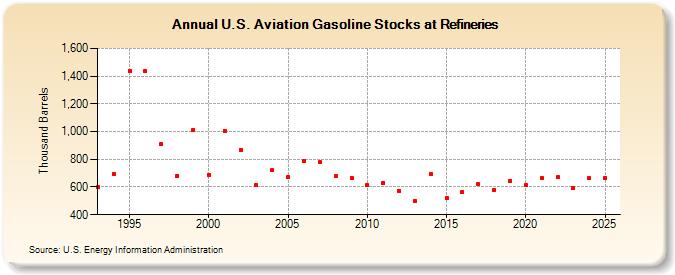
| U.S. Aviation Gasoline Stocks at Refineries (Thousand Barrels) | ||||||||
| Decade | Year-0 | Year-1 | Year-2 | Year-3 | Year-4 | Year-5 | Year-6 | Year-7 | Year-8 | Year-9 |
|---|---|---|---|---|---|---|---|---|---|---|
| 1990's | 600 | 693 | 1,437 | 1,435 | 908 | 682 | 1,012 | |||
| 2000's | 690 | 1,007 | 870 | 615 | 720 | 671 | 785 | 777 | 676 | 668 |
| 2010's | 611 | 629 | 574 | 502 | 693 | 522 | 565 | 620 | 581 | 644 |
| 2020's | 613 | 666 | 670 | 596 |
| - = No Data Reported; -- = Not Applicable; NA = Not Available; W = Withheld to avoid disclosure of individual company data. |
| Release Date: 8/30/2024 |
| Next Release Date: 8/29/2025 |