|
Download Data (XLS File) |
|
||||||||
|
||||||||
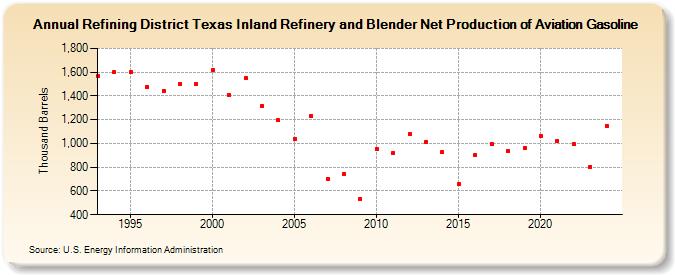
| Refining District Texas Inland Refinery and Blender Net Production of Aviation Gasoline (Thousand Barrels) | ||||||||
| Decade | Year-0 | Year-1 | Year-2 | Year-3 | Year-4 | Year-5 | Year-6 | Year-7 | Year-8 | Year-9 |
|---|---|---|---|---|---|---|---|---|---|---|
| 1990's | 1,568 | 1,599 | 1,598 | 1,478 | 1,444 | 1,502 | 1,498 | |||
| 2000's | 1,615 | 1,407 | 1,553 | 1,319 | 1,195 | 1,041 | 1,231 | 702 | 743 | 531 |
| 2010's | 954 | 921 | 1,078 | 1,015 | 927 | 660 | 903 | 997 | 936 | 962 |
| 2020's | 1,066 | 1,022 | 994 | 808 |
| - = No Data Reported; -- = Not Applicable; NA = Not Available; W = Withheld to avoid disclosure of individual company data. |
| Release Date: 3/29/2024 |
| Next Release Date: 8/30/2024 |