|
Download Data (XLS File) |
|
||||||||
|
||||||||
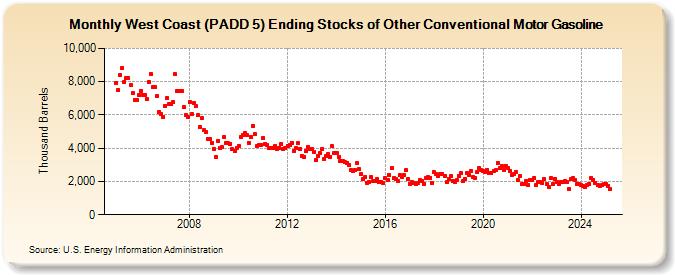
| West Coast (PADD 5) Ending Stocks of Other Conventional Motor Gasoline (Thousand Barrels) | ||||||||
| Year | Jan | Feb | Mar | Apr | May | Jun | Jul | Aug | Sep | Oct | Nov | Dec |
|---|---|---|---|---|---|---|---|---|---|---|---|---|
| 2005 | 7,937 | 7,502 | 8,390 | 8,827 | 7,989 | 8,214 | 8,213 | 7,812 | 7,316 | 6,888 | 6,897 | 7,192 |
| 2006 | 7,453 | 7,217 | 7,227 | 6,955 | 7,970 | 8,453 | 7,671 | 7,665 | 7,148 | 6,186 | 6,026 | 5,864 |
| 2007 | 6,551 | 7,014 | 6,664 | 6,644 | 6,773 | 8,436 | 7,445 | 7,461 | 7,450 | 6,456 | 5,968 | 5,904 |
| 2008 | 6,788 | 6,037 | 6,706 | 6,549 | 5,967 | 5,274 | 5,814 | 5,065 | 4,973 | 4,572 | 4,532 | 4,325 |
| 2009 | 3,933 | 3,489 | 4,437 | 4,032 | 4,052 | 4,681 | 4,300 | 4,292 | 4,239 | 3,924 | 3,849 | 4,021 |
| 2010 | 4,138 | 4,687 | 4,807 | 4,919 | 4,781 | 4,336 | 4,689 | 5,342 | 4,846 | 4,139 | 4,163 | 4,213 |
| 2011 | 4,602 | 4,275 | 4,205 | 3,994 | 3,996 | 4,027 | 4,122 | 3,945 | 4,041 | 4,254 | 3,944 | 4,002 |
| 2012 | 4,157 | 4,204 | 4,338 | 3,839 | 3,983 | 4,285 | 3,980 | 3,521 | 3,499 | 3,831 | 4,067 | 3,932 |
| 2013 | 3,935 | 3,782 | 3,295 | 3,547 | 3,691 | 3,926 | 3,321 | 3,542 | 3,632 | 3,475 | 4,116 | 3,724 |
| 2014 | 3,738 | 3,486 | 3,225 | 3,212 | 3,141 | 3,119 | 2,961 | 2,660 | 2,628 | 2,700 | 3,086 | 2,734 |
| 2015 | 2,429 | 2,150 | 2,242 | 1,927 | 1,938 | 2,250 | 2,005 | 2,011 | 2,134 | 1,967 | 1,952 | 1,903 |
| 2016 | 2,202 | 2,072 | 2,359 | 2,795 | 2,206 | 2,126 | 2,040 | 2,379 | 2,278 | 2,372 | 2,670 | 2,142 |
| 2017 | 1,854 | 1,966 | 1,907 | 1,839 | 1,932 | 2,076 | 2,048 | 1,844 | 2,209 | 2,246 | 2,233 | 1,888 |
| 2018 | 2,549 | 2,427 | 2,326 | 2,429 | 2,467 | 2,329 | 1,940 | 2,153 | 2,318 | 2,057 | 1,971 | 2,070 |
| 2019 | 2,331 | 2,480 | 1,999 | 2,165 | 2,523 | 2,384 | 2,618 | 2,259 | 2,219 | 2,558 | 2,820 | 2,685 |
| 2020 | 2,655 | 2,556 | 2,698 | 2,504 | 2,517 | 2,632 | 2,661 | 3,113 | 2,799 | 2,945 | 2,708 | 2,956 |
| 2021 | 2,825 | 2,650 | 2,360 | 2,444 | 2,570 | 2,070 | 2,299 | 1,825 | 1,847 | 2,034 | 1,789 | 2,102 |
| 2022 | 2,083 | 2,219 | 1,810 | 1,989 | 1,996 | 1,932 | 2,145 | 1,850 | 1,679 | 2,185 | 1,866 | 2,153 |
| 2023 | 1,992 | 1,839 | 1,986 | 1,943 | 1,998 | 1,965 | 1,542 | 2,128 | 2,192 | 2,079 | 1,826 | 1,741 |
| 2024 | 1,772 | |||||||||||
| - = No Data Reported; -- = Not Applicable; NA = Not Available; W = Withheld to avoid disclosure of individual company data. |
| Release Date: 3/29/2024 |
| Next Release Date: 4/30/2024 |