|
Download Data (XLS File) |
|
||||||||
|
||||||||
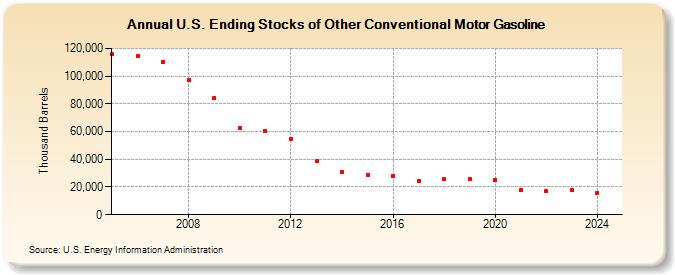
| U.S. Ending Stocks of Other Conventional Motor Gasoline (Thousand Barrels) | ||||||||
| Decade | Year-0 | Year-1 | Year-2 | Year-3 | Year-4 | Year-5 | Year-6 | Year-7 | Year-8 | Year-9 |
|---|---|---|---|---|---|---|---|---|---|---|
| 2000's | 115,769 | 114,442 | 110,186 | 97,334 | 84,258 | |||||
| 2010's | 62,713 | 60,121 | 54,811 | 38,676 | 30,908 | 28,366 | 28,161 | 24,188 | 25,443 | 25,751 |
| 2020's | 25,110 | 17,551 | 16,940 | 17,860 |
| - = No Data Reported; -- = Not Applicable; NA = Not Available; W = Withheld to avoid disclosure of individual company data. |
| Release Date: 4/30/2024 |
| Next Release Date: 8/30/2024 |