|
Download Data (XLS File) |
|
||||||||
|
||||||||
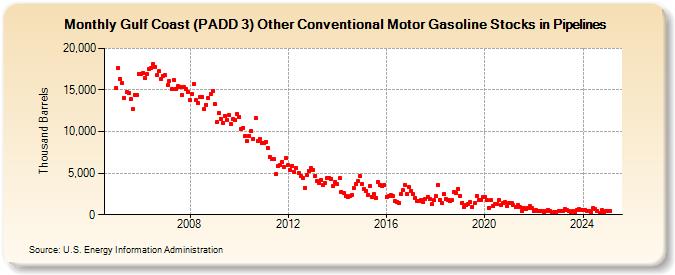
| Gulf Coast (PADD 3) Other Conventional Motor Gasoline Stocks in Pipelines (Thousand Barrels) | ||||||||
| Year | Jan | Feb | Mar | Apr | May | Jun | Jul | Aug | Sep | Oct | Nov | Dec |
|---|---|---|---|---|---|---|---|---|---|---|---|---|
| 2005 | 15,287 | 17,649 | 16,362 | 15,820 | 14,053 | 14,708 | 14,645 | 13,866 | 12,663 | 14,414 | 14,370 | 16,955 |
| 2006 | 16,934 | 17,063 | 16,444 | 16,905 | 17,513 | 17,667 | 18,118 | 17,816 | 16,812 | 17,223 | 16,332 | 16,626 |
| 2007 | 16,756 | 15,590 | 16,079 | 15,131 | 16,194 | 15,162 | 15,424 | 15,398 | 14,426 | 15,379 | 15,078 | 14,740 |
| 2008 | 13,783 | 14,495 | 15,741 | 13,753 | 13,439 | 14,110 | 14,127 | 12,673 | 13,203 | 14,011 | 14,487 | 14,927 |
| 2009 | 13,316 | 11,091 | 12,224 | 11,552 | 11,056 | 11,922 | 11,401 | 12,002 | 10,915 | 11,517 | 11,330 | 12,133 |
| 2010 | 11,799 | 10,278 | 10,458 | 9,492 | 8,915 | 9,515 | 10,090 | 9,160 | 11,623 | 8,823 | 9,117 | 8,665 |
| 2011 | 8,569 | 8,774 | 8,067 | 6,906 | 6,701 | 6,650 | 4,878 | 5,811 | 6,029 | 6,388 | 5,765 | 6,818 |
| 2012 | 5,923 | 5,349 | 5,890 | 5,118 | 5,565 | 5,024 | 4,660 | 4,463 | 3,234 | 4,824 | 5,280 | 5,643 |
| 2013 | 5,412 | 4,693 | 4,009 | 3,805 | 4,229 | 3,575 | 3,818 | 4,366 | 4,451 | 4,350 | 3,489 | 3,896 |
| 2014 | 3,663 | 4,372 | 2,778 | 2,593 | 2,261 | 2,190 | 2,238 | 2,405 | 3,167 | 3,670 | 3,999 | 4,598 |
| 2015 | 3,704 | 3,075 | 2,895 | 2,424 | 3,426 | 2,136 | 2,456 | 2,023 | 3,951 | 3,559 | 3,467 | 3,620 |
| 2016 | 2,135 | 2,262 | 2,355 | 2,220 | 1,622 | 1,500 | 1,382 | 2,443 | 2,932 | 3,586 | 2,525 | 3,304 |
| 2017 | 2,864 | 2,449 | 2,025 | 1,609 | 1,709 | 1,816 | 1,498 | 1,914 | 2,140 | 1,853 | 1,250 | 1,718 |
| 2018 | 2,234 | 3,525 | 1,824 | 1,365 | 2,458 | 1,847 | 1,821 | 1,595 | 1,736 | 2,761 | 2,632 | 3,113 |
| 2019 | 2,255 | 1,447 | 981 | 1,155 | 1,260 | 1,475 | 984 | 1,388 | 2,257 | 1,745 | 1,790 | 2,075 |
| 2020 | 2,171 | 1,761 | 848 | 1,737 | 1,053 | 1,335 | 1,289 | 1,814 | 1,153 | 1,402 | 1,472 | 1,050 |
| 2021 | 1,397 | 1,406 | 1,137 | 935 | 1,147 | 908 | 444 | 830 | 702 | 826 | 1,007 | 771 |
| 2022 | 410 | 510 | 427 | 471 | 452 | 371 | 495 | 615 | 400 | 256 | 287 | 341 |
| 2023 | 417 | 433 | 487 | 707 | 525 | 467 | 357 | 367 | 319 | 563 | 661 | 504 |
| 2024 | 549 | |||||||||||
| - = No Data Reported; -- = Not Applicable; NA = Not Available; W = Withheld to avoid disclosure of individual company data. |
| Release Date: 3/29/2024 |
| Next Release Date: 4/30/2024 |