|
Download Data (XLS File) |
|
||||||||
|
||||||||
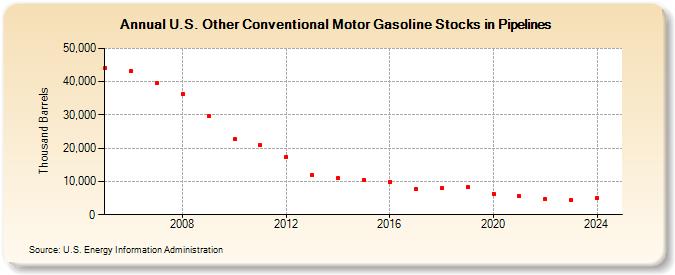
| U.S. Other Conventional Motor Gasoline Stocks in Pipelines (Thousand Barrels) | ||||||||
| Decade | Year-0 | Year-1 | Year-2 | Year-3 | Year-4 | Year-5 | Year-6 | Year-7 | Year-8 | Year-9 |
|---|---|---|---|---|---|---|---|---|---|---|
| 2000's | 43,969 | 43,094 | 39,542 | 36,415 | 29,654 | |||||
| 2010's | 22,723 | 20,887 | 17,443 | 11,855 | 10,961 | 10,462 | 9,982 | 7,725 | 7,968 | 8,290 |
| 2020's | 6,315 | 5,491 | 4,604 | 4,424 |
| - = No Data Reported; -- = Not Applicable; NA = Not Available; W = Withheld to avoid disclosure of individual company data. |
| Release Date: 3/29/2024 |
| Next Release Date: 8/30/2024 |