|
Download Data (XLS File) |
|
||||||||
|
||||||||
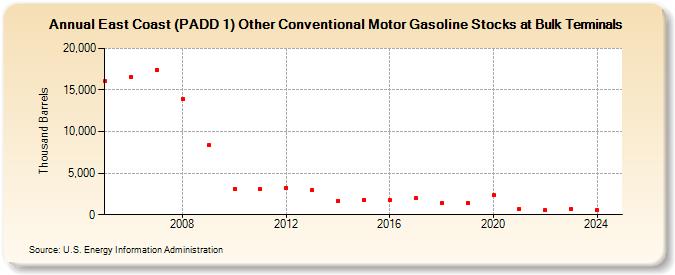
| East Coast (PADD 1) Other Conventional Motor Gasoline Stocks at Bulk Terminals (Thousand Barrels) | ||||||||
| Decade | Year-0 | Year-1 | Year-2 | Year-3 | Year-4 | Year-5 | Year-6 | Year-7 | Year-8 | Year-9 |
|---|---|---|---|---|---|---|---|---|---|---|
| 2000's | 16,041 | 16,564 | 17,400 | 13,955 | 8,346 | |||||
| 2010's | 3,135 | 3,071 | 3,246 | 2,938 | 1,693 | 1,816 | 1,734 | 1,966 | 1,427 | 1,438 |
| 2020's | 2,328 | 716 | 521 | 697 | 531 |
| - = No Data Reported; -- = Not Applicable; NA = Not Available; W = Withheld to avoid disclosure of individual company data. |
| Release Date: 6/30/2025 |
| Next Release Date: 8/29/2025 |