|
Download Data (XLS File) |
|
||||||||
|
||||||||
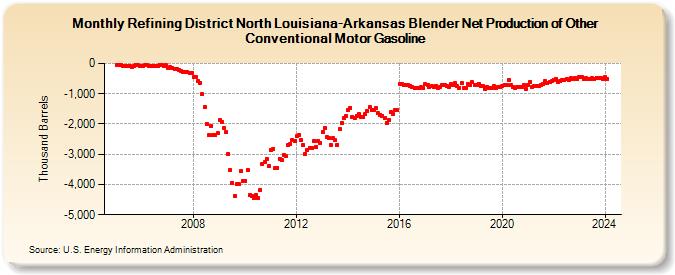
| Refining District North Louisiana-Arkansas Blender Net Production of Other Conventional Motor Gasoline (Thousand Barrels) | ||||||||
| Year | Jan | Feb | Mar | Apr | May | Jun | Jul | Aug | Sep | Oct | Nov | Dec |
|---|---|---|---|---|---|---|---|---|---|---|---|---|
| 2005 | -46 | -49 | -50 | -74 | -90 | -91 | -97 | -106 | -67 | -46 | -63 | -78 |
| 2006 | -90 | -57 | -45 | -78 | -88 | -70 | -68 | -89 | -66 | -41 | -71 | -52 |
| 2007 | -148 | -129 | -142 | -170 | -189 | -203 | -254 | -287 | -275 | -277 | -307 | -325 |
| 2008 | -439 | -448 | -592 | -645 | -1,013 | -1,431 | -1,997 | -2,374 | -2,075 | -2,349 | -2,358 | -2,311 |
| 2009 | -1,869 | -1,933 | -2,129 | -2,274 | -2,989 | -3,522 | -3,958 | -4,384 | -3,993 | -3,995 | -3,564 | -3,879 |
| 2010 | -3,877 | -3,526 | -4,362 | -4,385 | -4,448 | -4,349 | -4,444 | -4,167 | -3,338 | -3,266 | -3,163 | -3,401 |
| 2011 | -2,868 | -2,817 | -3,441 | -3,448 | -3,148 | -3,195 | -3,025 | -3,068 | -2,707 | -2,672 | -2,535 | -2,575 |
| 2012 | -2,409 | -2,372 | -2,530 | -2,684 | -2,988 | -2,864 | -2,794 | -2,787 | -2,564 | -2,760 | -2,577 | -2,614 |
| 2013 | -2,266 | -2,141 | -2,447 | -2,462 | -2,685 | -2,478 | -2,544 | -2,683 | -2,181 | -1,965 | -1,811 | -1,738 |
| 2014 | -1,530 | -1,463 | -1,755 | -1,790 | -1,731 | -1,670 | -1,755 | -1,761 | -1,675 | -1,574 | -1,451 | -1,547 |
| 2015 | -1,529 | -1,478 | -1,645 | -1,689 | -1,726 | -1,808 | -1,959 | -1,861 | -1,617 | -1,668 | -1,527 | -1,546 |
| 2016 | -674 | -672 | -711 | -713 | -714 | -728 | -780 | -821 | -798 | -796 | -793 | -797 |
| 2017 | -693 | -697 | -779 | -752 | -782 | -752 | -802 | -768 | -717 | -719 | -740 | -764 |
| 2018 | -681 | -714 | -657 | -754 | -802 | -649 | -808 | -795 | -675 | -712 | -628 | -717 |
| 2019 | -706 | -662 | -760 | -760 | -834 | -767 | -810 | -821 | -761 | -819 | -787 | -767 |
| 2020 | -732 | -702 | -696 | -542 | -720 | -794 | -803 | -775 | -780 | -791 | -727 | -829 |
| 2021 | -699 | -604 | -786 | -761 | -750 | -741 | -702 | -670 | -592 | -651 | -610 | -588 |
| 2022 | -542 | -512 | -598 | -571 | -559 | -538 | -519 | -532 | -493 | -503 | -479 | -527 |
| 2023 | -456 | -456 | -522 | -493 | -506 | -499 | -492 | -517 | -466 | -472 | -484 | -504 |
| 2024 | -463 | |||||||||||
| - = No Data Reported; -- = Not Applicable; NA = Not Available; W = Withheld to avoid disclosure of individual company data. |
| Release Date: 3/29/2024 |
| Next Release Date: 4/30/2024 |