|
Download Data (XLS File) |
|
||||||||
|
||||||||
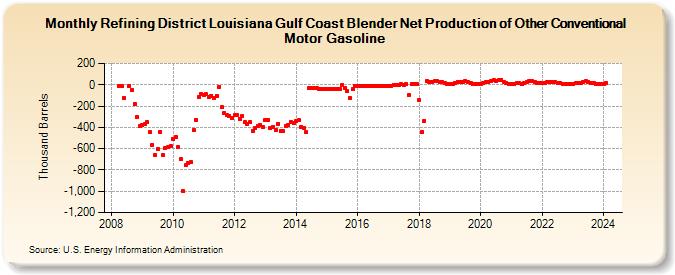
| Refining District Louisiana Gulf Coast Blender Net Production of Other Conventional Motor Gasoline (Thousand Barrels) | ||||||||
| Year | Jan | Feb | Mar | Apr | May | Jun | Jul | Aug | Sep | Oct | Nov | Dec |
|---|---|---|---|---|---|---|---|---|---|---|---|---|
| 2008 | -8 | -12 | -122 | -9 | -49 | -180 | -306 | -391 | ||||
| 2009 | -381 | -372 | -352 | -447 | -565 | -658 | -603 | -443 | -656 | -590 | -588 | -573 |
| 2010 | -506 | -491 | -588 | -701 | -1,001 | -758 | -730 | -726 | -424 | -328 | -111 | -86 |
| 2011 | -92 | -91 | -113 | -101 | -127 | -103 | -20 | -209 | -262 | -288 | -293 | -314 |
| 2012 | -286 | -288 | -317 | -295 | -353 | -369 | -352 | -434 | -410 | -390 | -380 | -392 |
| 2013 | -331 | -327 | -406 | -398 | -425 | -367 | -432 | -438 | -383 | -380 | -349 | -359 |
| 2014 | -340 | -331 | -394 | -404 | -448 | -33 | -33 | -32 | -33 | -38 | -35 | -39 |
| 2015 | -38 | -35 | -42 | -38 | -35 | -36 | 2 | -31 | -62 | -121 | -43 | -9 |
| 2016 | -10 | -12 | -7 | -11 | -11 | -11 | -9 | -9 | -10 | -11 | -11 | -11 |
| 2017 | -9 | -7 | 0 | 1 | 0 | 4 | 2 | 4 | -97 | 7 | 5 | 9 |
| 2018 | -147 | -442 | -337 | 31 | 30 | 25 | 33 | 31 | 25 | 24 | 16 | 9 |
| 2019 | 11 | 10 | 21 | 29 | 29 | 26 | 39 | 25 | 13 | 7 | 9 | 3 |
| 2020 | 8 | 14 | 23 | 30 | 32 | 44 | 36 | 42 | 48 | 27 | 18 | 9 |
| 2021 | 6 | 6 | 15 | 13 | 5 | 15 | 28 | 38 | 32 | 26 | 20 | 15 |
| 2022 | 16 | 17 | 24 | 25 | 24 | 26 | 21 | 18 | 12 | 8 | 10 | 11 |
| 2023 | 11 | 13 | 20 | 21 | 30 | 33 | 28 | 18 | 14 | 9 | 8 | 8 |
| 2024 | 8 | |||||||||||
| - = No Data Reported; -- = Not Applicable; NA = Not Available; W = Withheld to avoid disclosure of individual company data. |
| Release Date: 3/29/2024 |
| Next Release Date: 4/30/2024 |