|
Download Data (XLS File) |
|
||||||||
|
||||||||
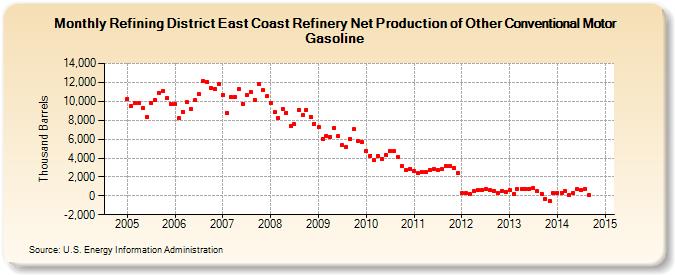
| Refining District East Coast Refinery Net Production of Other Conventional Motor Gasoline (Thousand Barrels) | ||||||||
| Year | Jan | Feb | Mar | Apr | May | Jun | Jul | Aug | Sep | Oct | Nov | Dec |
|---|---|---|---|---|---|---|---|---|---|---|---|---|
| 2005 | 10,275 | 9,489 | 9,782 | 9,816 | 9,295 | 8,336 | 9,857 | 10,184 | 10,919 | 11,082 | 10,380 | 9,726 |
| 2006 | 9,666 | 8,186 | 8,910 | 9,901 | 9,226 | 10,090 | 10,747 | 12,100 | 12,058 | 11,437 | 11,291 | 11,797 |
| 2007 | 10,650 | 8,743 | 10,441 | 10,494 | 11,264 | 9,701 | 10,644 | 10,972 | 10,171 | 11,863 | 11,154 | 10,518 |
| 2008 | 9,852 | 8,830 | 8,190 | 9,227 | 8,793 | 7,406 | 7,573 | 9,066 | 8,503 | 9,093 | 8,373 | 7,648 |
| 2009 | 7,245 | 6,001 | 6,353 | 6,252 | 7,186 | 6,287 | 5,329 | 5,173 | 6,031 | 7,038 | 5,814 | 5,689 |
| 2010 | 4,737 | 4,251 | 3,773 | 4,198 | 3,924 | 4,344 | 4,755 | 4,725 | 4,114 | 3,141 | 2,732 | 2,811 |
| 2011 | 2,655 | 2,403 | 2,548 | 2,524 | 2,757 | 2,838 | 2,782 | 2,786 | 3,195 | 3,145 | 2,953 | 2,414 |
| 2012 | 262 | 253 | 212 | 459 | 661 | 630 | 694 | 576 | 516 | 337 | 548 | 442 |
| 2013 | 569 | 220 | 722 | 714 | 773 | 760 | 827 | 465 | 224 | -328 | -527 | 271 |
| 2014 | 313 | 338 | 556 | 46 | 345 | 685 | 581 | 686 | 92 | |||
| - = No Data Reported; -- = Not Applicable; NA = Not Available; W = Withheld to avoid disclosure of individual company data. |
| Release Date: 6/28/2024 |
| Next Release Date: 7/31/2024 |