|
Download Data (XLS File) |
|
||||||||
|
||||||||
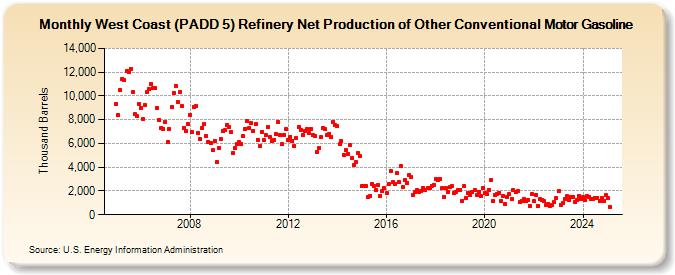
| West Coast (PADD 5) Refinery Net Production of Other Conventional Motor Gasoline (Thousand Barrels) | ||||||||
| Year | Jan | Feb | Mar | Apr | May | Jun | Jul | Aug | Sep | Oct | Nov | Dec |
|---|---|---|---|---|---|---|---|---|---|---|---|---|
| 2005 | 9,350 | 8,373 | 10,487 | 11,462 | 11,332 | 12,064 | 12,052 | 12,307 | 10,317 | 8,450 | 8,282 | 9,343 |
| 2006 | 8,991 | 8,072 | 9,198 | 10,298 | 10,563 | 11,041 | 10,625 | 10,644 | 8,984 | 8,004 | 7,308 | 7,252 |
| 2007 | 7,814 | 6,102 | 7,242 | 9,084 | 10,248 | 10,855 | 9,513 | 10,300 | 9,145 | 7,313 | 7,017 | 7,633 |
| 2008 | 8,401 | 6,934 | 9,039 | 9,119 | 6,892 | 6,368 | 7,337 | 7,609 | 6,620 | 6,143 | 6,067 | 5,421 |
| 2009 | 6,234 | 4,416 | 5,626 | 6,365 | 7,056 | 7,110 | 7,578 | 7,416 | 6,929 | 5,171 | 5,645 | 5,946 |
| 2010 | 6,127 | 5,964 | 6,584 | 7,245 | 7,890 | 7,261 | 7,681 | 7,067 | 7,606 | 6,320 | 5,762 | 6,982 |
| 2011 | 6,271 | 6,693 | 7,417 | 6,513 | 6,179 | 6,330 | 6,781 | 7,830 | 6,726 | 5,947 | 6,735 | 7,182 |
| 2012 | 6,279 | 6,563 | 6,241 | 5,787 | 6,452 | 7,389 | 7,113 | 6,750 | 7,071 | 7,232 | 6,865 | 7,238 |
| 2013 | 6,738 | 6,625 | 5,287 | 5,632 | 6,502 | 7,295 | 7,180 | 6,669 | 6,821 | 6,583 | 7,843 | 7,532 |
| 2014 | 7,444 | 5,941 | 6,204 | 5,036 | 5,438 | 5,131 | 5,867 | 4,763 | 4,153 | 4,424 | 5,199 | 4,905 |
| 2015 | 2,396 | 2,445 | 2,393 | 1,464 | 1,587 | 2,593 | 2,423 | 2,079 | 2,530 | 1,598 | 2,006 | 2,216 |
| 2016 | 1,814 | 2,587 | 3,688 | 2,759 | 2,621 | 3,498 | 2,719 | 4,099 | 2,292 | 2,908 | 2,662 | 3,344 |
| 2017 | 3,163 | 1,683 | 1,900 | 2,054 | 1,927 | 2,002 | 2,275 | 2,117 | 2,267 | 2,237 | 2,454 | 2,502 |
| 2018 | 3,008 | 2,886 | 3,021 | 2,211 | 1,501 | 2,248 | 1,920 | 2,311 | 2,390 | 1,830 | 1,949 | 2,092 |
| 2019 | 2,116 | 1,190 | 2,392 | 1,423 | 1,853 | 1,647 | 1,953 | 2,057 | 1,627 | 1,936 | 1,546 | 2,287 |
| 2020 | 1,832 | 1,740 | 2,063 | 2,949 | 1,155 | 1,692 | 1,725 | 1,857 | 1,149 | 1,584 | 919 | 1,487 |
| 2021 | 1,730 | 1,294 | 2,076 | 1,913 | 1,962 | 1,083 | 1,159 | 1,327 | 1,158 | 1,260 | 740 | 1,704 |
| 2022 | 1,132 | 1,681 | 770 | 1,282 | 1,265 | 1,114 | 845 | 932 | 772 | 851 | 1,036 | 1,430 |
| 2023 | 1,964 | 819 | 979 | 1,344 | 1,541 | 1,256 | 1,523 | 1,478 | 1,083 | 1,244 | 1,593 | 1,316 |
| 2024 | 1,466 | 1,198 | 1,536 | 1,530 | 1,335 | 1,364 | ||||||
| - = No Data Reported; -- = Not Applicable; NA = Not Available; W = Withheld to avoid disclosure of individual company data. |
| Release Date: 8/30/2024 |
| Next Release Date: 9/30/2024 |