|
Download Data (XLS File) |
|
||||||||
|
||||||||
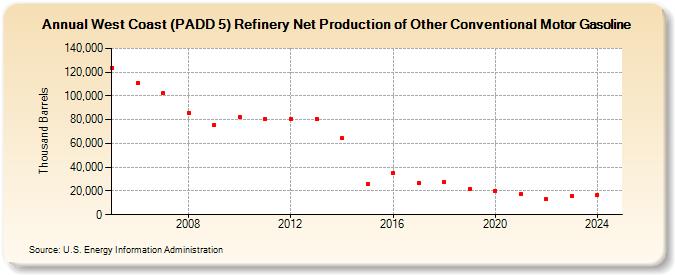
| West Coast (PADD 5) Refinery Net Production of Other Conventional Motor Gasoline (Thousand Barrels) | ||||||||
| Decade | Year-0 | Year-1 | Year-2 | Year-3 | Year-4 | Year-5 | Year-6 | Year-7 | Year-8 | Year-9 |
|---|---|---|---|---|---|---|---|---|---|---|
| 2000's | 123,819 | 110,980 | 102,266 | 85,950 | 75,492 | |||||
| 2010's | 82,489 | 80,604 | 80,980 | 80,707 | 64,505 | 25,730 | 34,991 | 26,581 | 27,367 | 22,027 |
| 2020's | 20,152 | 17,406 | 13,110 | 16,140 |
| - = No Data Reported; -- = Not Applicable; NA = Not Available; W = Withheld to avoid disclosure of individual company data. |
| Release Date: 6/28/2024 |
| Next Release Date: 8/30/2024 |