|
Download Data (XLS File) |
|
||||||||
|
||||||||
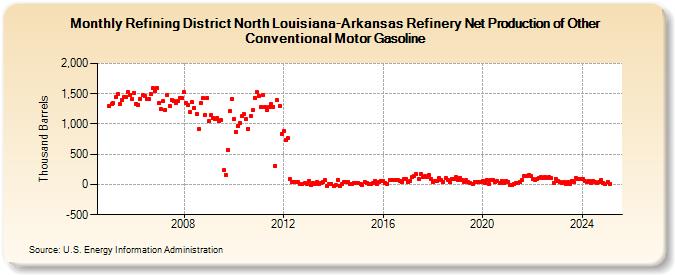
| Refining District North Louisiana-Arkansas Refinery Net Production of Other Conventional Motor Gasoline (Thousand Barrels) | ||||||||
| Year | Jan | Feb | Mar | Apr | May | Jun | Jul | Aug | Sep | Oct | Nov | Dec |
|---|---|---|---|---|---|---|---|---|---|---|---|---|
| 2005 | 1,296 | 1,328 | 1,339 | 1,441 | 1,492 | 1,327 | 1,390 | 1,442 | 1,454 | 1,525 | 1,482 | 1,405 |
| 2006 | 1,520 | 1,332 | 1,317 | 1,421 | 1,478 | 1,467 | 1,414 | 1,413 | 1,499 | 1,592 | 1,553 | 1,591 |
| 2007 | 1,347 | 1,241 | 1,375 | 1,228 | 1,485 | 1,298 | 1,402 | 1,375 | 1,345 | 1,374 | 1,432 | 1,424 |
| 2008 | 1,527 | 1,344 | 1,312 | 1,199 | 1,357 | 1,269 | 1,170 | 910 | 1,343 | 1,429 | 1,151 | 1,430 |
| 2009 | 1,044 | 1,147 | 1,101 | 1,087 | 1,097 | 1,046 | 1,060 | 234 | 163 | 569 | 1,207 | 1,410 |
| 2010 | 1,080 | 872 | 966 | 1,023 | 1,126 | 1,160 | 1,082 | 923 | 1,134 | 1,225 | 1,435 | 1,526 |
| 2011 | 1,469 | 1,280 | 1,485 | 1,288 | 1,239 | 1,276 | 1,331 | 1,285 | 310 | 1,390 | 1,301 | 841 |
| 2012 | 879 | 731 | 766 | 83 | 38 | 35 | 39 | 40 | 4 | 12 | 18 | 9 |
| 2013 | 50 | -17 | 20 | 14 | 45 | 9 | 30 | 36 | 72 | -30 | 11 | 16 |
| 2014 | -18 | -15 | 70 | -25 | 7 | 47 | 49 | 34 | 14 | 10 | 27 | 22 |
| 2015 | 22 | 1 | -1 | 44 | 32 | 7 | 7 | 22 | 55 | 1 | 39 | 54 |
| 2016 | 50 | 32 | 15 | 71 | 75 | 80 | 68 | 76 | 59 | 44 | 83 | 85 |
| 2017 | 37 | 59 | 122 | 143 | 177 | 89 | 176 | 123 | 132 | 124 | 149 | 88 |
| 2018 | 37 | 55 | 56 | 99 | 77 | 40 | 111 | 80 | 35 | 89 | 87 | 119 |
| 2019 | 67 | 110 | 73 | 49 | 67 | 42 | 24 | 6 | 43 | 40 | 48 | 33 |
| 2020 | 59 | 19 | 72 | 6 | 80 | 76 | 40 | 54 | 31 | 64 | 23 | 57 |
| 2021 | 45 | -10 | -1 | 5 | 30 | 27 | 36 | 76 | 134 | 140 | 151 | 141 |
| 2022 | 90 | 76 | 86 | 110 | 118 | 113 | 125 | 113 | 123 | 102 | 29 | 97 |
| 2023 | 55 | 37 | 18 | 38 | 10 | 46 | 16 | 61 | 44 | 111 | 96 | 89 |
| 2024 | 91 | |||||||||||
| - = No Data Reported; -- = Not Applicable; NA = Not Available; W = Withheld to avoid disclosure of individual company data. |
| Release Date: 3/29/2024 |
| Next Release Date: 4/30/2024 |