|
Download Data (XLS File) |
|
||||||||
|
||||||||
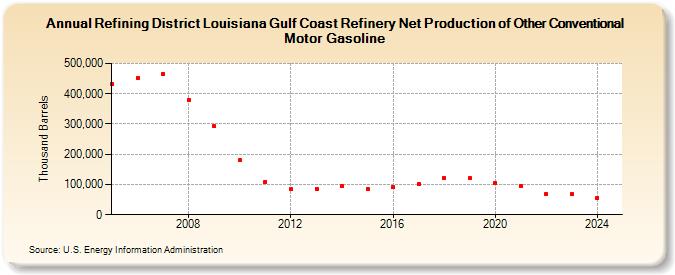
| Refining District Louisiana Gulf Coast Refinery Net Production of Other Conventional Motor Gasoline (Thousand Barrels) | ||||||||
| Decade | Year-0 | Year-1 | Year-2 | Year-3 | Year-4 | Year-5 | Year-6 | Year-7 | Year-8 | Year-9 |
|---|---|---|---|---|---|---|---|---|---|---|
| 2000's | 430,533 | 452,952 | 466,827 | 380,507 | 291,658 | |||||
| 2010's | 179,396 | 109,370 | 84,153 | 86,519 | 93,291 | 86,267 | 91,298 | 100,044 | 121,034 | 120,532 |
| 2020's | 105,388 | 95,212 | 67,698 | 66,905 |
| - = No Data Reported; -- = Not Applicable; NA = Not Available; W = Withheld to avoid disclosure of individual company data. |
| Release Date: 6/28/2024 |
| Next Release Date: 8/30/2024 |