|
Download Data (XLS File) |
|
||||||||
|
||||||||
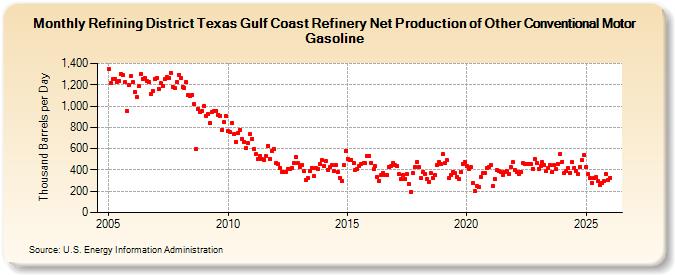
| Refining District Texas Gulf Coast Refinery Net Production of Other Conventional Motor Gasoline (Thousand Barrels per Day) | ||||||||
| Year | Jan | Feb | Mar | Apr | May | Jun | Jul | Aug | Sep | Oct | Nov | Dec |
|---|---|---|---|---|---|---|---|---|---|---|---|---|
| 2005 | 1,345 | 1,213 | 1,252 | 1,258 | 1,227 | 1,237 | 1,304 | 1,290 | 1,225 | 952 | 1,200 | 1,279 |
| 2006 | 1,223 | 1,135 | 1,085 | 1,191 | 1,298 | 1,257 | 1,263 | 1,234 | 1,227 | 1,118 | 1,145 | 1,252 |
| 2007 | 1,267 | 1,162 | 1,214 | 1,187 | 1,251 | 1,272 | 1,259 | 1,313 | 1,183 | 1,169 | 1,228 | 1,295 |
| 2008 | 1,262 | 1,181 | 1,174 | 1,226 | 1,102 | 1,099 | 1,104 | 1,018 | 597 | 974 | 945 | 955 |
| 2009 | 1,000 | 906 | 925 | 841 | 944 | 951 | 956 | 919 | 910 | 779 | 846 | 904 |
| 2010 | 764 | 752 | 842 | 740 | 661 | 750 | 778 | 695 | 667 | 604 | 653 | 734 |
| 2011 | 695 | 598 | 549 | 502 | 535 | 499 | 496 | 532 | 626 | 503 | 580 | 600 |
| 2012 | 466 | 452 | 417 | 382 | 384 | 383 | 407 | 409 | 423 | 466 | 519 | 464 |
| 2013 | 429 | 445 | 389 | 310 | 324 | 387 | 422 | 339 | 420 | 409 | 455 | 491 |
| 2014 | 438 | 482 | 404 | 424 | 442 | 390 | 448 | 377 | 327 | 297 | 442 | 579 |
| 2015 | 507 | 497 | 498 | 462 | 403 | 410 | 439 | 460 | 470 | 465 | 535 | 535 |
| 2016 | 470 | 406 | 434 | 333 | 299 | 354 | 374 | 352 | 350 | 426 | 440 | 470 |
| 2017 | 444 | 437 | 362 | 316 | 353 | 319 | 360 | 266 | 194 | 372 | 430 | 475 |
| 2018 | 425 | 320 | 381 | 366 | 319 | 288 | 367 | 329 | 350 | 443 | 472 | 452 |
| 2019 | 546 | 464 | 490 | 324 | 351 | 383 | 367 | 332 | 312 | 382 | 457 | 478 |
| 2020 | 439 | 407 | 424 | 275 | 203 | 247 | 236 | 334 | 369 | 371 | 417 | 432 |
| 2021 | 445 | 250 | 318 | 397 | 394 | 378 | 356 | 385 | 393 | 362 | 426 | 471 |
| 2022 | 402 | 383 | 362 | 385 | 464 | 457 | 453 | 459 | 459 | 412 | 504 | 465 |
| 2023 | 410 | 435 | 474 | 445 | 391 | 423 | 444 | 385 | 443 | 409 | 456 | 551 |
| 2024 | 479 | |||||||||||
| - = No Data Reported; -- = Not Applicable; NA = Not Available; W = Withheld to avoid disclosure of individual company data. |
| Release Date: 3/29/2024 |
| Next Release Date: 4/30/2024 |