|
Download Data (XLS File) |
|
||||||||
|
||||||||
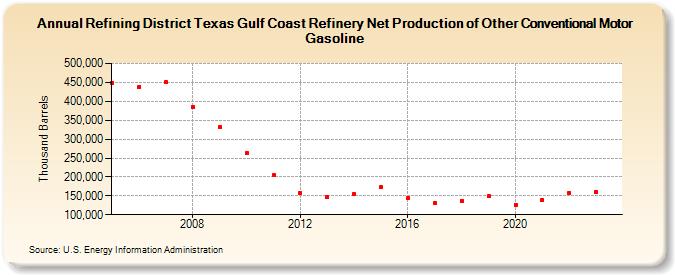
| Refining District Texas Gulf Coast Refinery Net Production of Other Conventional Motor Gasoline (Thousand Barrels) | ||||||||
| Decade | Year-0 | Year-1 | Year-2 | Year-3 | Year-4 | Year-5 | Year-6 | Year-7 | Year-8 | Year-9 |
|---|---|---|---|---|---|---|---|---|---|---|
| 2000's | 449,696 | 439,061 | 450,438 | 385,552 | 331,086 | |||||
| 2010's | 262,754 | 204,165 | 157,731 | 146,559 | 153,511 | 172,796 | 143,610 | 131,579 | 137,395 | 148,631 |
| 2020's | 126,660 | 139,501 | 158,390 | 160,136 |
| - = No Data Reported; -- = Not Applicable; NA = Not Available; W = Withheld to avoid disclosure of individual company data. |
| Release Date: 6/28/2024 |
| Next Release Date: 8/30/2024 |