|
Download Data (XLS File) |
|
||||||||
|
||||||||
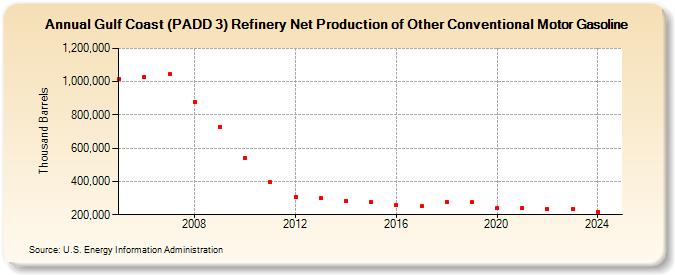
| Gulf Coast (PADD 3) Refinery Net Production of Other Conventional Motor Gasoline (Thousand Barrels) | ||||||||
| Decade | Year-0 | Year-1 | Year-2 | Year-3 | Year-4 | Year-5 | Year-6 | Year-7 | Year-8 | Year-9 |
|---|---|---|---|---|---|---|---|---|---|---|
| 2000's | 1,016,441 | 1,029,802 | 1,045,817 | 878,154 | 729,611 | |||||
| 2010's | 541,752 | 395,292 | 309,026 | 298,573 | 284,257 | 278,888 | 255,754 | 250,728 | 277,206 | 274,620 |
| 2020's | 238,396 | 241,594 | 233,968 | 233,159 |
| - = No Data Reported; -- = Not Applicable; NA = Not Available; W = Withheld to avoid disclosure of individual company data. |
| Release Date: 6/28/2024 |
| Next Release Date: 8/30/2024 |