|
Download Data (XLS File) |
|
||||||||
|
||||||||
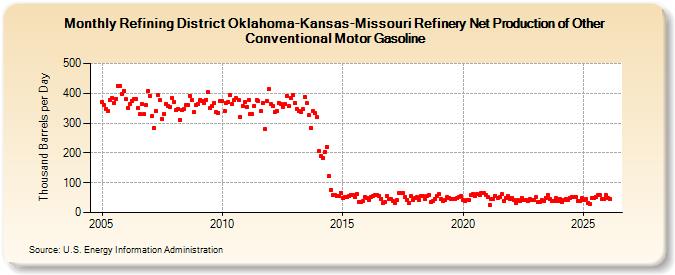
| Refining District Oklahoma-Kansas-Missouri Refinery Net Production of Other Conventional Motor Gasoline (Thousand Barrels per Day) | ||||||||
| Year | Jan | Feb | Mar | Apr | May | Jun | Jul | Aug | Sep | Oct | Nov | Dec |
|---|---|---|---|---|---|---|---|---|---|---|---|---|
| 2005 | 371 | 360 | 347 | 341 | 378 | 385 | 369 | 382 | 426 | 426 | 399 | 409 |
| 2006 | 380 | 351 | 363 | 374 | 382 | 382 | 351 | 329 | 364 | 331 | 360 | 408 |
| 2007 | 392 | 323 | 284 | 341 | 393 | 376 | 315 | 331 | 365 | 356 | 354 | 385 |
| 2008 | 372 | 343 | 348 | 312 | 344 | 347 | 360 | 361 | 392 | 377 | 338 | 362 |
| 2009 | 365 | 378 | 373 | 369 | 379 | 403 | 350 | 358 | 369 | 337 | 335 | 375 |
| 2010 | 373 | 340 | 368 | 371 | 394 | 364 | 376 | 383 | 378 | 322 | 358 | 371 |
| 2011 | 355 | 379 | 329 | 331 | 359 | 376 | 374 | 339 | 367 | 281 | 374 | 414 |
| 2012 | 363 | 359 | 337 | 340 | 367 | 365 | 355 | 363 | 391 | 356 | 385 | 394 |
| 2013 | 367 | 348 | 341 | 336 | 346 | 387 | 366 | 326 | 285 | 341 | 333 | 320 |
| 2014 | 206 | 190 | 183 | 203 | 221 | 122 | 75 | 58 | 60 | 56 | 56 | 67 |
| 2015 | 49 | 51 | 51 | 54 | 59 | 60 | 52 | 63 | 36 | 36 | 38 | 52 |
| 2016 | 48 | 42 | 52 | 56 | 59 | 59 | 56 | 47 | 31 | 34 | 56 | 47 |
| 2017 | 44 | 39 | 31 | 41 | 66 | 64 | 66 | 52 | 43 | 31 | 55 | 42 |
| 2018 | 50 | 51 | 41 | 55 | 54 | 47 | 55 | 59 | 35 | 38 | 47 | 56 |
| 2019 | 62 | 47 | 39 | 42 | 51 | 49 | 46 | 47 | 47 | 48 | 53 | 56 |
| 2020 | 42 | 38 | 41 | 41 | 58 | 63 | 57 | 61 | 59 | 64 | 64 | 60 |
| 2021 | 51 | 27 | 46 | 47 | 57 | 50 | 51 | 61 | 38 | 48 | 55 | 45 |
| 2022 | 50 | 43 | 32 | 42 | 39 | 50 | 41 | 43 | 38 | 44 | 43 | 41 |
| 2023 | 51 | 35 | 36 | 42 | 39 | 50 | 60 | 45 | 38 | 39 | 48 | 38 |
| 2024 | 45 | 35 | 43 | 46 | 41 | 50 | ||||||
| - = No Data Reported; -- = Not Applicable; NA = Not Available; W = Withheld to avoid disclosure of individual company data. |
| Release Date: 8/30/2024 |
| Next Release Date: 9/30/2024 |