|
Download Data (XLS File) |
|
||||||||
|
||||||||
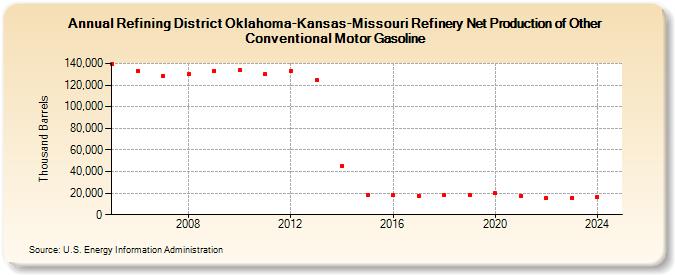
| Refining District Oklahoma-Kansas-Missouri Refinery Net Production of Other Conventional Motor Gasoline (Thousand Barrels) | ||||||||
| Decade | Year-0 | Year-1 | Year-2 | Year-3 | Year-4 | Year-5 | Year-6 | Year-7 | Year-8 | Year-9 |
|---|---|---|---|---|---|---|---|---|---|---|
| 2000's | 139,692 | 133,048 | 128,275 | 129,877 | 133,458 | |||||
| 2010's | 133,782 | 129,957 | 133,416 | 124,582 | 45,452 | 18,283 | 17,952 | 17,510 | 17,901 | 17,808 |
| 2020's | 19,786 | 17,572 | 15,360 | 15,859 |
| - = No Data Reported; -- = Not Applicable; NA = Not Available; W = Withheld to avoid disclosure of individual company data. |
| Release Date: 8/30/2024 |
| Next Release Date: 8/29/2025 |