|
Download Data (XLS File) |
|
||||||||
|
||||||||
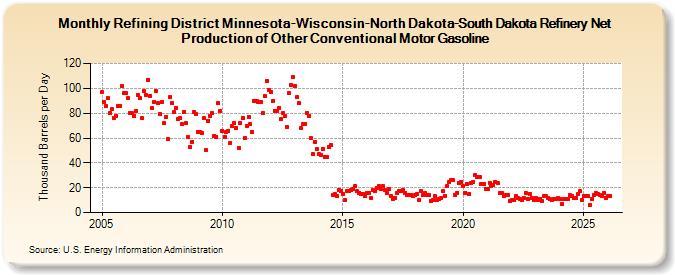
| Refining District Minnesota-Wisconsin-North Dakota-South Dakota Refinery Net Production of Other Conventional Motor Gasoline (Thousand Barrels per Day) | ||||||||
| Year | Jan | Feb | Mar | Apr | May | Jun | Jul | Aug | Sep | Oct | Nov | Dec |
|---|---|---|---|---|---|---|---|---|---|---|---|---|
| 2005 | 97 | 89 | 86 | 92 | 80 | 83 | 76 | 78 | 86 | 86 | 102 | 96 |
| 2006 | 96 | 92 | 80 | 80 | 78 | 82 | 95 | 92 | 76 | 98 | 95 | 107 |
| 2007 | 94 | 84 | 89 | 98 | 88 | 79 | 89 | 72 | 77 | 59 | 93 | 88 |
| 2008 | 81 | 84 | 75 | 76 | 71 | 81 | 72 | 61 | 53 | 57 | 81 | 79 |
| 2009 | 65 | 65 | 64 | 76 | 50 | 74 | 78 | 80 | 62 | 61 | 88 | 82 |
| 2010 | 66 | 61 | 65 | 66 | 56 | 70 | 72 | 68 | 52 | 72 | 76 | 60 |
| 2011 | 70 | 77 | 71 | 65 | 90 | 90 | 89 | 89 | 80 | 94 | 106 | 99 |
| 2012 | 97 | 90 | 82 | 82 | 84 | 75 | 80 | 78 | 69 | 96 | 103 | 109 |
| 2013 | 102 | 93 | 88 | 68 | 71 | 71 | 80 | 78 | 60 | 47 | 57 | 51 |
| 2014 | 47 | 46 | 51 | 45 | 45 | 53 | 54 | 14 | 15 | 13 | 18 | 17 |
| 2015 | 15 | 10 | 17 | 17 | 18 | 19 | 21 | 17 | 16 | 15 | 15 | 13 |
| 2016 | 16 | 16 | 12 | 18 | 17 | 20 | 21 | 19 | 21 | 18 | 16 | 19 |
| 2017 | 13 | 11 | 12 | 16 | 17 | 17 | 18 | 16 | 14 | 14 | 14 | 13 |
| 2018 | 14 | 15 | 10 | 17 | 14 | 16 | 14 | 14 | 9 | 10 | 13 | 10 |
| 2019 | 11 | 12 | 17 | 13 | 21 | 25 | 26 | 26 | 14 | 16 | 24 | 25 |
| 2020 | 21 | 16 | 23 | 15 | 24 | 25 | 30 | 29 | 29 | 23 | 23 | 19 |
| 2021 | 19 | 24 | 21 | 22 | 25 | 24 | 16 | 16 | 13 | 14 | 14 | 9 |
| 2022 | 10 | 10 | 13 | 12 | 11 | 10 | 12 | 16 | 11 | 15 | 12 | 10 |
| 2023 | 12 | 10 | 11 | 9 | 13 | 13 | 12 | 11 | 10 | 11 | 11 | 12 |
| 2024 | 11 | |||||||||||
| - = No Data Reported; -- = Not Applicable; NA = Not Available; W = Withheld to avoid disclosure of individual company data. |
| Release Date: 3/29/2024 |
| Next Release Date: 4/30/2024 |