|
Download Data (XLS File) |
|
||||||||
|
||||||||
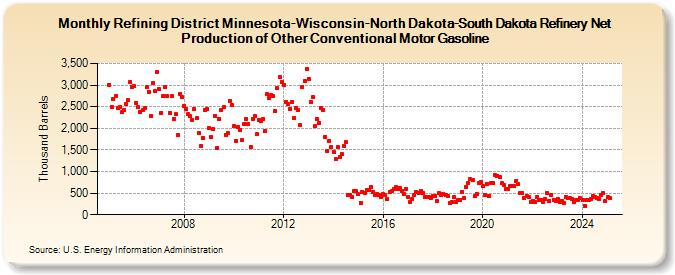
| Refining District Minnesota-Wisconsin-North Dakota-South Dakota Refinery Net Production of Other Conventional Motor Gasoline (Thousand Barrels) | ||||||||
| Year | Jan | Feb | Mar | Apr | May | Jun | Jul | Aug | Sep | Oct | Nov | Dec |
|---|---|---|---|---|---|---|---|---|---|---|---|---|
| 2005 | 3,006 | 2,493 | 2,675 | 2,746 | 2,467 | 2,485 | 2,369 | 2,432 | 2,567 | 2,653 | 3,074 | 2,964 |
| 2006 | 2,981 | 2,582 | 2,485 | 2,387 | 2,433 | 2,464 | 2,946 | 2,847 | 2,284 | 3,043 | 2,852 | 3,306 |
| 2007 | 2,903 | 2,357 | 2,745 | 2,953 | 2,741 | 2,363 | 2,745 | 2,222 | 2,323 | 1,844 | 2,800 | 2,724 |
| 2008 | 2,518 | 2,437 | 2,328 | 2,280 | 2,193 | 2,440 | 2,234 | 1,899 | 1,591 | 1,780 | 2,423 | 2,458 |
| 2009 | 2,002 | 1,807 | 1,982 | 2,281 | 1,555 | 2,221 | 2,423 | 2,483 | 1,851 | 1,888 | 2,639 | 2,542 |
| 2010 | 2,053 | 1,713 | 2,027 | 1,966 | 1,723 | 2,103 | 2,223 | 2,098 | 1,569 | 2,221 | 2,284 | 1,860 |
| 2011 | 2,182 | 2,163 | 2,211 | 1,937 | 2,787 | 2,702 | 2,764 | 2,751 | 2,398 | 2,927 | 3,191 | 3,082 |
| 2012 | 3,011 | 2,616 | 2,556 | 2,450 | 2,616 | 2,238 | 2,476 | 2,421 | 2,072 | 2,961 | 3,097 | 3,377 |
| 2013 | 3,150 | 2,610 | 2,723 | 2,044 | 2,216 | 2,121 | 2,469 | 2,415 | 1,809 | 1,469 | 1,713 | 1,566 |
| 2014 | 1,453 | 1,290 | 1,575 | 1,341 | 1,397 | 1,594 | 1,672 | 449 | 454 | 414 | 545 | 541 |
| 2015 | 470 | 275 | 531 | 497 | 563 | 565 | 652 | 532 | 466 | 476 | 449 | 416 |
| 2016 | 485 | 459 | 358 | 535 | 540 | 599 | 637 | 595 | 623 | 554 | 468 | 599 |
| 2017 | 405 | 296 | 366 | 467 | 524 | 501 | 554 | 509 | 408 | 421 | 407 | 393 |
| 2018 | 441 | 432 | 316 | 499 | 446 | 482 | 448 | 431 | 275 | 298 | 402 | 300 |
| 2019 | 342 | 348 | 531 | 395 | 645 | 737 | 816 | 794 | 426 | 486 | 728 | 762 |
| 2020 | 663 | 455 | 705 | 442 | 736 | 737 | 922 | 904 | 874 | 728 | 694 | 597 |
| 2021 | 598 | 669 | 657 | 658 | 783 | 709 | 494 | 499 | 380 | 434 | 417 | 292 |
| 2022 | 319 | 291 | 399 | 352 | 342 | 303 | 360 | 494 | 318 | 464 | 350 | 309 |
| 2023 | 375 | 288 | 328 | 269 | 413 | 380 | 378 | 355 | 285 | 347 | 332 | 380 |
| 2024 | 334 | |||||||||||
| - = No Data Reported; -- = Not Applicable; NA = Not Available; W = Withheld to avoid disclosure of individual company data. |
| Release Date: 3/29/2024 |
| Next Release Date: 4/30/2024 |