|
Download Data (XLS File) |
|
||||||||
|
||||||||
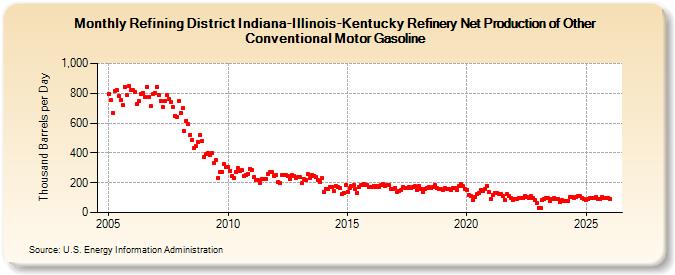
| Refining District Indiana-Illinois-Kentucky Refinery Net Production of Other Conventional Motor Gasoline (Thousand Barrels per Day) | ||||||||
| Year | Jan | Feb | Mar | Apr | May | Jun | Jul | Aug | Sep | Oct | Nov | Dec |
|---|---|---|---|---|---|---|---|---|---|---|---|---|
| 2005 | 797 | 753 | 671 | 816 | 821 | 784 | 754 | 720 | 845 | 787 | 849 | 821 |
| 2006 | 822 | 808 | 726 | 746 | 798 | 805 | 778 | 844 | 778 | 713 | 794 | 800 |
| 2007 | 843 | 786 | 750 | 710 | 749 | 790 | 761 | 739 | 710 | 651 | 643 | 746 |
| 2008 | 668 | 701 | 546 | 616 | 594 | 523 | 488 | 435 | 444 | 473 | 517 | 481 |
| 2009 | 372 | 394 | 398 | 383 | 398 | 331 | 353 | 234 | 272 | 273 | 327 | 308 |
| 2010 | 308 | 282 | 247 | 229 | 271 | 297 | 281 | 283 | 248 | 249 | 262 | 294 |
| 2011 | 284 | 240 | 220 | 217 | 201 | 224 | 222 | 223 | 260 | 270 | 270 | 245 |
| 2012 | 250 | 204 | 195 | 249 | 250 | 253 | 242 | 227 | 251 | 247 | 233 | 236 |
| 2013 | 237 | 195 | 224 | 218 | 258 | 235 | 250 | 243 | 236 | 218 | 208 | 233 |
| 2014 | 139 | 160 | 156 | 173 | 172 | 147 | 180 | 171 | 166 | 124 | 130 | 183 |
| 2015 | 140 | 166 | 175 | 183 | 156 | 133 | 172 | 186 | 191 | 184 | 184 | 171 |
| 2016 | 169 | 177 | 169 | 179 | 174 | 182 | 193 | 179 | 184 | 182 | 156 | 160 |
| 2017 | 167 | 137 | 144 | 154 | 172 | 166 | 165 | 169 | 164 | 169 | 175 | 150 |
| 2018 | 176 | 160 | 135 | 160 | 163 | 169 | 166 | 172 | 182 | 162 | 159 | 155 |
| 2019 | 153 | 162 | 159 | 159 | 154 | 165 | 166 | 151 | 175 | 191 | 176 | 158 |
| 2020 | 152 | 115 | 112 | 82 | 102 | 124 | 131 | 154 | 142 | 159 | 181 | 135 |
| 2021 | 92 | 119 | 131 | 131 | 126 | 126 | 114 | 86 | 122 | 114 | 101 | 82 |
| 2022 | 94 | 91 | 100 | 97 | 99 | 108 | 105 | 100 | 108 | 95 | 83 | 64 |
| 2023 | 33 | 32 | 81 | 91 | 96 | 95 | 78 | 90 | 101 | 89 | 88 | 74 |
| 2024 | 75 | |||||||||||
| - = No Data Reported; -- = Not Applicable; NA = Not Available; W = Withheld to avoid disclosure of individual company data. |
| Release Date: 3/29/2024 |
| Next Release Date: 4/30/2024 |