|
Download Data (XLS File) |
|
||||||||
|
||||||||
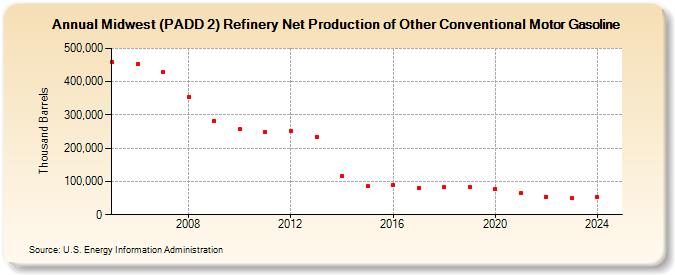
| Midwest (PADD 2) Refinery Net Production of Other Conventional Motor Gasoline (Thousand Barrels) | ||||||||
| Decade | Year-0 | Year-1 | Year-2 | Year-3 | Year-4 | Year-5 | Year-6 | Year-7 | Year-8 | Year-9 |
|---|---|---|---|---|---|---|---|---|---|---|
| 2000's | 458,033 | 451,852 | 428,952 | 354,034 | 281,996 | |||||
| 2010's | 256,509 | 248,529 | 251,889 | 234,825 | 115,999 | 86,234 | 88,582 | 81,583 | 82,242 | 84,715 |
| 2020's | 76,714 | 64,965 | 54,436 | 48,869 |
| - = No Data Reported; -- = Not Applicable; NA = Not Available; W = Withheld to avoid disclosure of individual company data. |
| Release Date: 6/28/2024 |
| Next Release Date: 8/30/2024 |