|
Download Data (XLS File) |
|
||||||||
|
||||||||
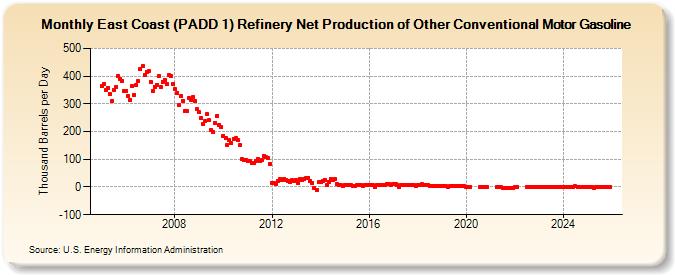
| East Coast (PADD 1) Refinery Net Production of Other Conventional Motor Gasoline (Thousand Barrels per Day) | ||||||||
| Year | Jan | Feb | Mar | Apr | May | Jun | Jul | Aug | Sep | Oct | Nov | Dec |
|---|---|---|---|---|---|---|---|---|---|---|---|---|
| 2005 | 364 | 372 | 350 | 358 | 335 | 312 | 351 | 362 | 400 | 391 | 383 | 348 |
| 2006 | 347 | 328 | 314 | 364 | 333 | 369 | 381 | 425 | 436 | 404 | 415 | 417 |
| 2007 | 379 | 346 | 362 | 369 | 399 | 360 | 379 | 386 | 371 | 404 | 401 | 372 |
| 2008 | 353 | 339 | 295 | 328 | 312 | 275 | 273 | 321 | 313 | 325 | 310 | 280 |
| 2009 | 269 | 249 | 227 | 238 | 263 | 240 | 204 | 197 | 232 | 257 | 225 | 217 |
| 2010 | 185 | 176 | 152 | 170 | 158 | 174 | 175 | 170 | 151 | 101 | 97 | 97 |
| 2011 | 92 | 92 | 88 | 88 | 95 | 101 | 95 | 96 | 113 | 107 | 105 | 84 |
| 2012 | 14 | 15 | 11 | 22 | 28 | 27 | 29 | 25 | 23 | 17 | 25 | 21 |
| 2013 | 25 | 15 | 30 | 25 | 28 | 32 | 34 | 22 | 14 | -3 | -10 | 17 |
| 2014 | 18 | 20 | 26 | 7 | 18 | 30 | 26 | 29 | 10 | 7 | 7 | 3 |
| 2015 | 7 | 8 | 7 | 7 | 5 | 5 | 6 | 6 | 7 | 5 | 7 | 8 |
| 2016 | 8 | 7 | 7 | 1 | 6 | 8 | 8 | 8 | 8 | 9 | 9 | 8 |
| 2017 | 9 | 9 | 7 | 1 | 7 | 8 | 7 | 7 | 8 | 6 | 8 | 5 |
| 2018 | 8 | 8 | 9 | 7 | 8 | 8 | 2 | 2 | 3 | 3 | 2 | 2 |
| 2019 | 2 | 3 | 2 | 1 | 2 | 3 | 2 | 2 | 4 | 3 | 2 | 2 |
| 2020 | 0 | 0 | 0 | 0 | 0 | 0 | -1 | |||||
| 2021 | -1 | 0 | 0 | -2 | -3 | -2 | -3 | -2 | -2 | |||
| 2022 | -1 | -1 | 0 | 0 | 0 | 0 | 0 | -1 | ||||
| 2023 | 1 | 1 | 0 | 0 | 1 | 1 | 1 | 0 | 0 | 0 | 1 | 1 |
| 2024 | 0 | |||||||||||
| - = No Data Reported; -- = Not Applicable; NA = Not Available; W = Withheld to avoid disclosure of individual company data. |
| Release Date: 3/29/2024 |
| Next Release Date: 4/30/2024 |