|
Download Data (XLS File) |
|
||||||||
|
||||||||
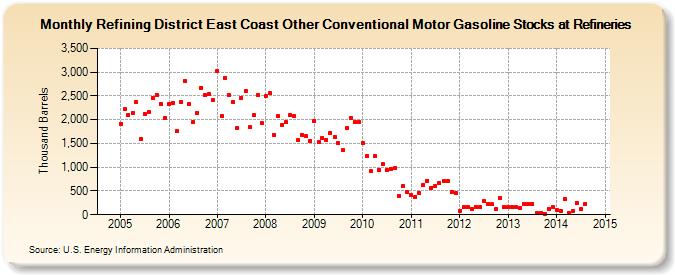
| Refining District East Coast Other Conventional Motor Gasoline Stocks at Refineries (Thousand Barrels) | ||||||||
| Year | Jan | Feb | Mar | Apr | May | Jun | Jul | Aug | Sep | Oct | Nov | Dec |
|---|---|---|---|---|---|---|---|---|---|---|---|---|
| 2005 | 1,912 | 2,215 | 2,103 | 2,136 | 2,368 | 1,586 | 2,120 | 2,152 | 2,462 | 2,522 | 2,339 | 2,037 |
| 2006 | 2,331 | 2,346 | 1,755 | 2,367 | 2,821 | 2,337 | 1,950 | 2,145 | 2,677 | 2,515 | 2,535 | 2,407 |
| 2007 | 3,034 | 2,077 | 2,878 | 2,509 | 2,365 | 1,829 | 2,461 | 2,607 | 1,845 | 2,098 | 2,510 | 1,931 |
| 2008 | 2,503 | 2,553 | 1,681 | 2,087 | 1,894 | 1,943 | 2,103 | 2,070 | 1,569 | 1,679 | 1,646 | 1,553 |
| 2009 | 1,974 | 1,529 | 1,615 | 1,578 | 1,721 | 1,643 | 1,514 | 1,358 | 1,828 | 2,037 | 1,948 | 1,958 |
| 2010 | 1,504 | 1,235 | 910 | 1,227 | 944 | 1,058 | 942 | 970 | 993 | 402 | 604 | 470 |
| 2011 | 410 | 379 | 465 | 633 | 715 | 572 | 597 | 665 | 700 | 708 | 484 | 449 |
| 2012 | 79 | 154 | 166 | 115 | 169 | 156 | 287 | 233 | 217 | 126 | 355 | 160 |
| 2013 | 157 | 161 | 157 | 145 | 232 | 225 | 229 | 29 | 33 | 23 | 124 | 156 |
| 2014 | 96 | 79 | 327 | 42 | 74 | 257 | 113 | 216 | ||||
| - = No Data Reported; -- = Not Applicable; NA = Not Available; W = Withheld to avoid disclosure of individual company data. |
| Release Date: 6/28/2024 |
| Next Release Date: 7/31/2024 |
Referring Pages: