|
Download Data (XLS File) |
|
||||||||
|
||||||||
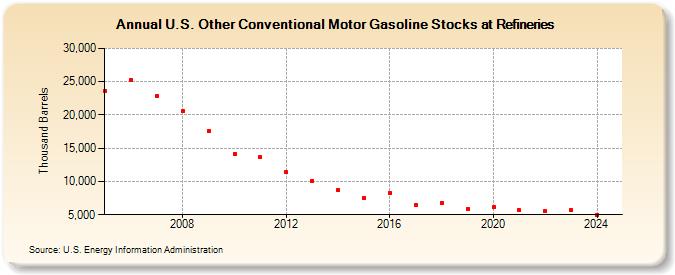
| U.S. Other Conventional Motor Gasoline Stocks at Refineries (Thousand Barrels) | ||||||||
| Decade | Year-0 | Year-1 | Year-2 | Year-3 | Year-4 | Year-5 | Year-6 | Year-7 | Year-8 | Year-9 |
|---|---|---|---|---|---|---|---|---|---|---|
| 2000's | 23,601 | 25,280 | 22,892 | 20,562 | 17,571 | |||||
| 2010's | 14,181 | 13,604 | 11,401 | 10,068 | 8,712 | 7,498 | 8,282 | 6,524 | 6,815 | 5,921 |
| 2020's | 6,098 | 5,664 | 5,515 | 5,644 |
| - = No Data Reported; -- = Not Applicable; NA = Not Available; W = Withheld to avoid disclosure of individual company data. |
| Release Date: 6/28/2024 |
| Next Release Date: 8/30/2024 |