|
Download Data (XLS File) |
|
||||||||
|
||||||||
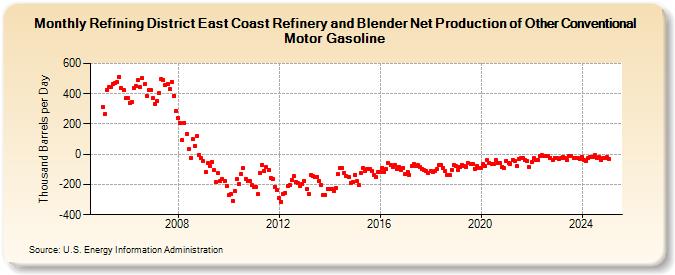
| Refining District East Coast Refinery and Blender Net Production of Other Conventional Motor Gasoline (Thousand Barrels per Day) | ||||||||
| Year | Jan | Feb | Mar | Apr | May | Jun | Jul | Aug | Sep | Oct | Nov | Dec |
|---|---|---|---|---|---|---|---|---|---|---|---|---|
| 2005 | 314 | 265 | 425 | 443 | 444 | 463 | 470 | 477 | 512 | 435 | 422 | 369 |
| 2006 | 373 | 340 | 347 | 441 | 448 | 488 | 442 | 503 | 462 | 383 | 425 | 422 |
| 2007 | 370 | 333 | 352 | 404 | 495 | 491 | 456 | 465 | 431 | 480 | 388 | 287 |
| 2008 | 239 | 204 | 97 | 207 | 136 | 32 | -23 | 98 | 56 | 119 | -6 | -28 |
| 2009 | -48 | -119 | -60 | -76 | -50 | -105 | -184 | -126 | -177 | -164 | -179 | -209 |
| 2010 | -272 | -266 | -307 | -246 | -167 | -194 | -130 | -93 | -162 | -178 | -179 | -206 |
| 2011 | -214 | -218 | -266 | -122 | -71 | -109 | -87 | -102 | -155 | -166 | -215 | -238 |
| 2012 | -291 | -314 | -264 | -254 | -208 | -203 | -168 | -147 | -183 | -193 | -209 | -200 |
| 2013 | -177 | -230 | -264 | -137 | -146 | -153 | -150 | -176 | -202 | -269 | -268 | -228 |
| 2014 | -231 | -232 | -242 | -223 | -134 | -94 | -92 | -121 | -146 | -151 | -187 | -184 |
| 2015 | -135 | -180 | -204 | -125 | -91 | -109 | -99 | -98 | -109 | -139 | -151 | -120 |
| 2016 | -115 | -91 | -117 | -101 | -57 | -69 | -84 | -72 | -99 | -83 | -104 | -90 |
| 2017 | -134 | -116 | -138 | -79 | -66 | -79 | -72 | -87 | -97 | -107 | -110 | -123 |
| 2018 | -108 | -117 | -113 | -100 | -72 | -70 | -91 | -112 | -139 | -138 | -104 | -70 |
| 2019 | -79 | -105 | -84 | -72 | -77 | -84 | -59 | -63 | -67 | -96 | -75 | -94 |
| 2020 | -89 | -65 | -81 | -41 | -57 | -62 | -63 | -37 | -60 | -60 | -86 | -94 |
| 2021 | -43 | -56 | -62 | -37 | -42 | -81 | -33 | -25 | -26 | -41 | -44 | -85 |
| 2022 | -51 | -27 | -35 | -36 | -11 | -7 | -9 | -11 | -13 | -23 | -36 | -23 |
| 2023 | -24 | -34 | -28 | -18 | -27 | -37 | -13 | -11 | -24 | -25 | -25 | -31 |
| 2024 | -16 | |||||||||||
| - = No Data Reported; -- = Not Applicable; NA = Not Available; W = Withheld to avoid disclosure of individual company data. |
| Release Date: 3/29/2024 |
| Next Release Date: 4/30/2024 |