|
Download Data (XLS File) |
|
||||||||
|
||||||||
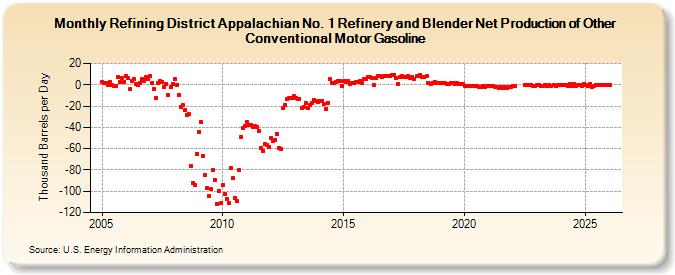
| Refining District Appalachian No. 1 Refinery and Blender Net Production of Other Conventional Motor Gasoline (Thousand Barrels per Day) | ||||||||
| Year | Jan | Feb | Mar | Apr | May | Jun | Jul | Aug | Sep | Oct | Nov | Dec |
|---|---|---|---|---|---|---|---|---|---|---|---|---|
| 2005 | 3 | 2 | 2 | 0 | 3 | 0 | -1 | -1 | 7 | 3 | 6 | 3 |
| 2006 | 8 | 6 | -4 | 4 | 5 | 1 | 0 | 2 | 5 | 4 | 7 | 5 |
| 2007 | 8 | 2 | -4 | -12 | 2 | 4 | 3 | -2 | 1 | -10 | -2 | 1 |
| 2008 | 5 | 0 | -10 | -21 | -19 | -24 | -28 | -27 | -76 | -92 | -94 | -65 |
| 2009 | -44 | -35 | -67 | -85 | -97 | -104 | -98 | -80 | -89 | -112 | -100 | -111 |
| 2010 | -94 | -103 | -107 | -111 | -78 | -88 | -106 | -109 | -80 | -49 | -41 | -39 |
| 2011 | -35 | -38 | -38 | -40 | -39 | -40 | -43 | -59 | -62 | -56 | -57 | -58 |
| 2012 | -50 | -53 | -52 | -46 | -59 | -60 | -22 | -19 | -13 | -12 | -12 | -11 |
| 2013 | -12 | -13 | -13 | -22 | -21 | -17 | -22 | -19 | -17 | -14 | -15 | -16 |
| 2014 | -15 | -15 | -18 | -23 | -17 | 5 | 2 | 2 | 3 | 4 | 4 | -1 |
| 2015 | 4 | 3 | 4 | 1 | 2 | 2 | 3 | 3 | 4 | 2 | 5 | 5 |
| 2016 | 7 | 7 | 6 | 0 | 6 | 8 | 8 | 7 | 8 | 8 | 8 | 8 |
| 2017 | 9 | 9 | 6 | 1 | 7 | 8 | 7 | 7 | 8 | 6 | 7 | 5 |
| 2018 | 8 | 8 | 9 | 7 | 7 | 8 | 2 | 1 | 2 | 3 | 2 | 2 |
| 2019 | 2 | 2 | 2 | 1 | 1 | 2 | 2 | 1 | 2 | 1 | 1 | 1 |
| 2020 | -1 | -1 | -1 | -1 | -1 | -1 | -1 | -2 | -2 | -1 | -2 | -1 |
| 2021 | -1 | -1 | -1 | -2 | -2 | -3 | -2 | -3 | -2 | -3 | -2 | -2 |
| 2022 | -1 | -1 | 0 | 0 | 0 | 0 | -1 | -1 | ||||
| 2023 | 0 | 0 | -1 | -1 | 0 | -1 | 0 | -1 | 0 | -1 | 0 | 0 |
| 2024 | 0 | |||||||||||
| - = No Data Reported; -- = Not Applicable; NA = Not Available; W = Withheld to avoid disclosure of individual company data. |
| Release Date: 3/29/2024 |
| Next Release Date: 4/30/2024 |