|
Download Data (XLS File) |
|
||||||||
|
||||||||
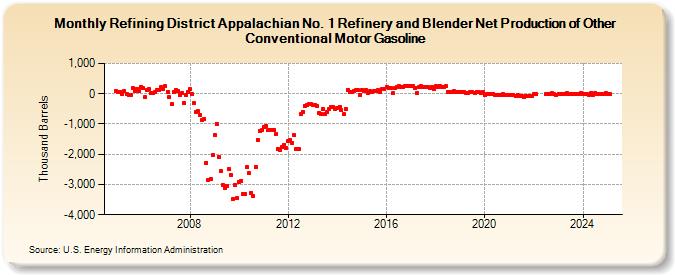
| Refining District Appalachian No. 1 Refinery and Blender Net Production of Other Conventional Motor Gasoline (Thousand Barrels) | ||||||||
| Year | Jan | Feb | Mar | Apr | May | Jun | Jul | Aug | Sep | Oct | Nov | Dec |
|---|---|---|---|---|---|---|---|---|---|---|---|---|
| 2005 | 90 | 49 | 69 | -1 | 82 | -10 | -34 | -42 | 196 | 99 | 172 | 91 |
| 2006 | 235 | 180 | -123 | 128 | 146 | 20 | 14 | 59 | 137 | 111 | 210 | 167 |
| 2007 | 249 | 66 | -122 | -352 | 50 | 124 | 95 | -55 | 20 | -303 | -58 | 41 |
| 2008 | 141 | -7 | -318 | -616 | -587 | -708 | -870 | -845 | -2,276 | -2,846 | -2,819 | -2,020 |
| 2009 | -1,369 | -988 | -2,086 | -2,553 | -3,007 | -3,112 | -3,049 | -2,489 | -2,681 | -3,479 | -3,004 | -3,455 |
| 2010 | -2,916 | -2,883 | -3,330 | -3,319 | -2,427 | -2,630 | -3,280 | -3,365 | -2,410 | -1,523 | -1,224 | -1,214 |
| 2011 | -1,088 | -1,062 | -1,193 | -1,213 | -1,204 | -1,197 | -1,338 | -1,828 | -1,848 | -1,745 | -1,695 | -1,802 |
| 2012 | -1,548 | -1,544 | -1,623 | -1,380 | -1,823 | -1,813 | -680 | -589 | -391 | -374 | -353 | -345 |
| 2013 | -377 | -375 | -416 | -645 | -665 | -520 | -679 | -599 | -503 | -441 | -444 | -492 |
| 2014 | -468 | -428 | -546 | -679 | -513 | 135 | 59 | 52 | 98 | 113 | 112 | -45 |
| 2015 | 134 | 96 | 131 | 35 | 76 | 69 | 90 | 79 | 117 | 64 | 148 | 151 |
| 2016 | 217 | 190 | 194 | 14 | 180 | 236 | 247 | 228 | 229 | 259 | 252 | 242 |
| 2017 | 268 | 240 | 199 | 17 | 210 | 243 | 217 | 223 | 234 | 184 | 213 | 157 |
| 2018 | 247 | 217 | 272 | 208 | 232 | 240 | 66 | 44 | 70 | 79 | 58 | 56 |
| 2019 | 55 | 61 | 61 | 29 | 39 | 66 | 47 | 34 | 68 | 44 | 29 | 42 |
| 2020 | -29 | -24 | -16 | -18 | -25 | -38 | -42 | -50 | -54 | -23 | -51 | -29 |
| 2021 | -29 | -28 | -33 | -63 | -48 | -90 | -70 | -101 | -69 | -82 | -72 | -70 |
| 2022 | -18 | -14 | -15 | 3 | 5 | 8 | -15 | -33 | ||||
| 2023 | 4 | -1 | -22 | -16 | 10 | -18 | 3 | -20 | -5 | -16 | -12 | 12 |
| 2024 | -12 | |||||||||||
| - = No Data Reported; -- = Not Applicable; NA = Not Available; W = Withheld to avoid disclosure of individual company data. |
| Release Date: 3/29/2024 |
| Next Release Date: 4/30/2024 |