|
Download Data (XLS File) |
|
||||||||
|
||||||||
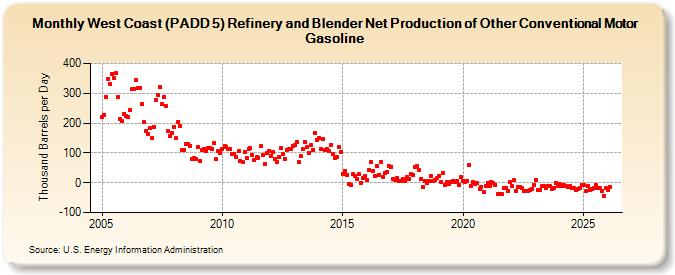
| West Coast (PADD 5) Refinery and Blender Net Production of Other Conventional Motor Gasoline (Thousand Barrels per Day) | ||||||||
| Year | Jan | Feb | Mar | Apr | May | Jun | Jul | Aug | Sep | Oct | Nov | Dec |
|---|---|---|---|---|---|---|---|---|---|---|---|---|
| 2005 | 221 | 228 | 288 | 348 | 330 | 366 | 350 | 367 | 289 | 215 | 208 | 232 |
| 2006 | 223 | 222 | 244 | 313 | 316 | 343 | 319 | 319 | 263 | 203 | 173 | 163 |
| 2007 | 182 | 151 | 187 | 276 | 295 | 321 | 264 | 287 | 256 | 173 | 156 | 168 |
| 2008 | 188 | 149 | 205 | 190 | 110 | 111 | 131 | 130 | 124 | 78 | 83 | 80 |
| 2009 | 119 | 74 | 110 | 112 | 107 | 117 | 116 | 113 | 132 | 78 | 106 | 100 |
| 2010 | 114 | 122 | 121 | 114 | 113 | 98 | 98 | 85 | 105 | 72 | 69 | 103 |
| 2011 | 84 | 114 | 116 | 93 | 75 | 85 | 84 | 122 | 94 | 62 | 101 | 108 |
| 2012 | 89 | 102 | 79 | 70 | 87 | 115 | 97 | 79 | 109 | 112 | 114 | 124 |
| 2013 | 127 | 138 | 71 | 91 | 112 | 137 | 119 | 99 | 125 | 111 | 166 | 145 |
| 2014 | 150 | 114 | 147 | 109 | 114 | 106 | 127 | 95 | 84 | 86 | 120 | 104 |
| 2015 | 30 | 40 | 27 | -4 | -6 | 28 | 24 | 13 | 28 | 0 | 16 | 24 |
| 2016 | 10 | 42 | 69 | 41 | 24 | 56 | 26 | 71 | 18 | 34 | 36 | 57 |
| 2017 | 54 | 11 | 8 | 15 | 6 | 5 | 14 | 6 | 18 | 14 | 28 | 26 |
| 2018 | 52 | 56 | 44 | 12 | -14 | 6 | -2 | 5 | 21 | 5 | 10 | 16 |
| 2019 | 22 | 2 | 33 | -6 | 1 | -5 | 4 | 6 | 1 | 5 | -7 | 18 |
| 2020 | 7 | 3 | 7 | 61 | -11 | 2 | -4 | -2 | -22 | -14 | -30 | -10 |
| 2021 | 0 | -12 | 4 | 0 | -6 | -37 | -38 | -39 | -19 | -18 | -29 | 3 |
| 2022 | -10 | 8 | -28 | -14 | -14 | -16 | -29 | -27 | -27 | -25 | -21 | -7 |
| 2023 | 10 | -25 | -25 | -12 | -11 | -17 | -11 | -12 | -21 | -16 | 0 | -12 |
| 2024 | -4 | -10 | -7 | -10 | ||||||||
| - = No Data Reported; -- = Not Applicable; NA = Not Available; W = Withheld to avoid disclosure of individual company data. |
| Release Date: 6/28/2024 |
| Next Release Date: 7/31/2024 |