|
Download Data (XLS File) |
|
||||||||
|
||||||||
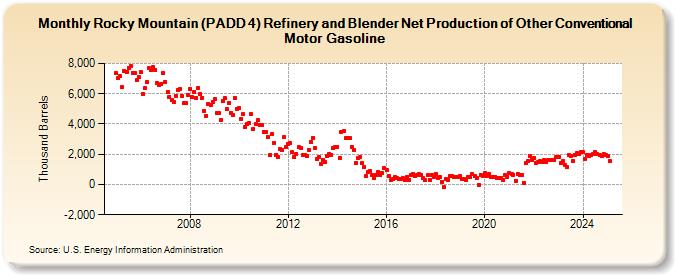
| Rocky Mountain (PADD 4) Refinery and Blender Net Production of Other Conventional Motor Gasoline (Thousand Barrels) | ||||||||
| Year | Jan | Feb | Mar | Apr | May | Jun | Jul | Aug | Sep | Oct | Nov | Dec |
|---|---|---|---|---|---|---|---|---|---|---|---|---|
| 2005 | 7,365 | 7,027 | 7,168 | 6,417 | 7,504 | 7,439 | 7,714 | 7,819 | 7,393 | 7,378 | 6,876 | 7,119 |
| 2006 | 7,407 | 6,005 | 6,346 | 6,762 | 7,680 | 7,561 | 7,749 | 7,600 | 6,678 | 6,561 | 6,654 | 7,364 |
| 2007 | 6,791 | 6,115 | 5,816 | 5,570 | 5,482 | 5,863 | 6,231 | 6,308 | 5,859 | 5,386 | 5,359 | 5,936 |
| 2008 | 6,312 | 5,800 | 6,140 | 5,747 | 6,384 | 5,991 | 5,746 | 4,890 | 4,535 | 5,339 | 5,274 | 5,449 |
| 2009 | 5,643 | 4,728 | 4,729 | 4,270 | 5,540 | 5,692 | 4,987 | 5,394 | 4,734 | 4,594 | 5,717 | 5,015 |
| 2010 | 5,035 | 4,333 | 4,636 | 3,810 | 4,001 | 4,072 | 4,641 | 3,688 | 4,016 | 4,242 | 3,923 | 3,932 |
| 2011 | 3,469 | 3,461 | 3,151 | 1,950 | 3,336 | 2,761 | 1,974 | 1,793 | 2,336 | 2,308 | 3,122 | 2,475 |
| 2012 | 2,706 | 2,714 | 2,128 | 1,793 | 2,040 | 2,458 | 2,398 | 1,925 | 1,981 | 1,875 | 2,261 | 2,778 |
| 2013 | 3,079 | 2,428 | 1,701 | 1,806 | 1,323 | 1,615 | 1,485 | 1,877 | 2,041 | 1,976 | 2,402 | 2,474 |
| 2014 | 2,479 | 1,782 | 3,488 | 3,517 | 3,054 | 3,062 | 3,089 | 2,494 | 2,252 | 1,436 | 1,723 | 1,800 |
| 2015 | 1,402 | 1,145 | 546 | 827 | 899 | 648 | 419 | 620 | 833 | 649 | 765 | 1,085 |
| 2016 | 968 | 562 | 275 | 335 | 469 | 407 | 381 | 348 | 400 | 277 | 511 | 312 |
| 2017 | 607 | 685 | 545 | 597 | 694 | 610 | 403 | 263 | 594 | 308 | 640 | 512 |
| 2018 | 680 | 426 | 513 | 186 | -193 | 362 | 318 | 576 | 588 | 467 | 467 | 488 |
| 2019 | 541 | 364 | 345 | 286 | 523 | 483 | 664 | 552 | 411 | -5 | 647 | 585 |
| 2020 | 735 | 585 | 701 | 486 | 482 | 498 | 418 | 447 | 444 | 303 | 593 | 500 |
| 2021 | 729 | 698 | 643 | 253 | 702 | 635 | 631 | 112 | 1,410 | 1,551 | 1,860 | 1,639 |
| 2022 | 1,739 | 1,407 | 1,467 | 1,535 | 1,497 | 1,611 | 1,494 | 1,633 | 1,644 | 1,599 | 1,645 | 1,785 |
| 2023 | 1,786 | 1,387 | 1,552 | 1,304 | 1,138 | 1,929 | 1,896 | 1,560 | 1,974 | 2,053 | 1,997 | 2,127 |
| 2024 | 2,123 | 1,660 | 1,974 | 1,870 | 1,956 | 2,002 | 2,121 | 2,005 | 1,964 | 1,861 | 2,011 | 1,958 |
| 2025 | 1,892 | 1,555 | 1,633 | 1,498 | ||||||||
| - = No Data Reported; -- = Not Applicable; NA = Not Available; W = Withheld to avoid disclosure of individual company data. |
| Release Date: 6/30/2025 |
| Next Release Date: 7/31/2025 |