|
Download Data (XLS File) |
|
||||||||
|
||||||||
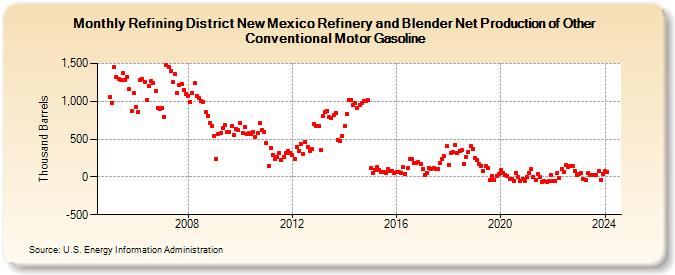
| Refining District New Mexico Refinery and Blender Net Production of Other Conventional Motor Gasoline (Thousand Barrels) | ||||||||
| Year | Jan | Feb | Mar | Apr | May | Jun | Jul | Aug | Sep | Oct | Nov | Dec |
|---|---|---|---|---|---|---|---|---|---|---|---|---|
| 2005 | 1,063 | 982 | 1,447 | 1,327 | 1,301 | 1,280 | 1,368 | 1,284 | 1,316 | 1,161 | 868 | 1,105 |
| 2006 | 918 | 859 | 1,281 | 1,300 | 1,259 | 1,016 | 1,207 | 1,268 | 1,244 | 1,142 | 906 | 900 |
| 2007 | 914 | 797 | 1,482 | 1,457 | 1,396 | 1,251 | 1,359 | 1,114 | 1,209 | 1,227 | 1,151 | 1,097 |
| 2008 | 1,072 | 991 | 1,112 | 1,236 | 1,075 | 1,043 | 1,010 | 995 | 852 | 809 | 713 | 679 |
| 2009 | 539 | 236 | 569 | 585 | 646 | 680 | 596 | 597 | 672 | 552 | 637 | 623 |
| 2010 | 718 | 587 | 664 | 565 | 578 | 567 | 592 | 533 | 580 | 708 | 618 | 593 |
| 2011 | 449 | 150 | 382 | 295 | 231 | 261 | 311 | 225 | 257 | 318 | 341 | 322 |
| 2012 | 284 | 242 | 397 | 343 | 429 | 305 | 465 | 400 | 345 | 363 | 697 | 675 |
| 2013 | 678 | 358 | 807 | 858 | 878 | 789 | 778 | 818 | 851 | 493 | 478 | 543 |
| 2014 | 671 | 836 | 1,019 | 1,021 | 955 | 976 | 905 | 956 | 982 | 1,008 | 1,006 | 1,013 |
| 2015 | 117 | 52 | 95 | 126 | 95 | 70 | 68 | 57 | 99 | 80 | 83 | 53 |
| 2016 | 60 | 63 | 55 | 134 | 43 | 114 | 239 | 231 | 184 | 180 | 195 | 174 |
| 2017 | 104 | 28 | 53 | 116 | 109 | 112 | 106 | 102 | 178 | 240 | 273 | 405 |
| 2018 | 161 | 315 | 324 | 428 | 316 | 347 | 351 | 176 | 261 | 330 | 413 | 368 |
| 2019 | 256 | 217 | 169 | 149 | 80 | 140 | 115 | -42 | 13 | -45 | 16 | 40 |
| 2020 | 86 | 47 | 19 | 13 | -33 | -34 | -48 | 56 | -1 | -50 | -22 | -49 |
| 2021 | -6 | 57 | 98 | 1 | -42 | 40 | 0 | -64 | -60 | -65 | -59 | 28 |
| 2022 | -57 | -51 | 48 | -12 | 107 | 66 | 159 | 135 | 139 | 139 | 82 | 19 |
| 2023 | 41 | 46 | -31 | -42 | 51 | 19 | 29 | 26 | 27 | 81 | -37 | 44 |
| 2024 | 79 | |||||||||||
| - = No Data Reported; -- = Not Applicable; NA = Not Available; W = Withheld to avoid disclosure of individual company data. |
| Release Date: 3/29/2024 |
| Next Release Date: 4/30/2024 |