|
Download Data (XLS File) |
|
||||||||
|
||||||||
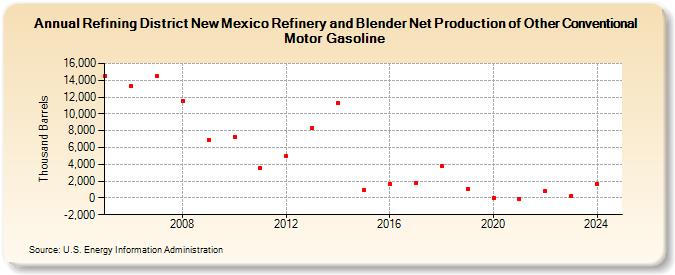
| Refining District New Mexico Refinery and Blender Net Production of Other Conventional Motor Gasoline (Thousand Barrels) | ||||||||
| Decade | Year-0 | Year-1 | Year-2 | Year-3 | Year-4 | Year-5 | Year-6 | Year-7 | Year-8 | Year-9 |
|---|---|---|---|---|---|---|---|---|---|---|
| 2000's | 14,502 | 13,300 | 14,454 | 11,587 | 6,932 | |||||
| 2010's | 7,303 | 3,542 | 4,945 | 8,329 | 11,348 | 995 | 1,672 | 1,826 | 3,790 | 1,108 |
| 2020's | -16 | -72 | 774 | 249 | 1,648 |
| - = No Data Reported; -- = Not Applicable; NA = Not Available; W = Withheld to avoid disclosure of individual company data. |
| Release Date: 6/30/2025 |
| Next Release Date: 8/29/2025 |