|
Download Data (XLS File) |
|
||||||||
|
||||||||
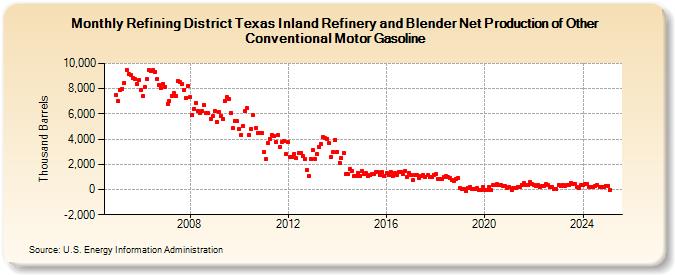
| Refining District Texas Inland Refinery and Blender Net Production of Other Conventional Motor Gasoline (Thousand Barrels) | ||||||||
| Year | Jan | Feb | Mar | Apr | May | Jun | Jul | Aug | Sep | Oct | Nov | Dec |
|---|---|---|---|---|---|---|---|---|---|---|---|---|
| 2005 | 7,478 | 6,988 | 7,909 | 7,989 | 8,485 | 9,495 | 9,146 | 9,085 | 8,877 | 8,747 | 8,384 | 8,665 |
| 2006 | 7,884 | 7,388 | 8,150 | 8,730 | 9,470 | 9,406 | 9,451 | 9,349 | 8,779 | 8,300 | 8,026 | 8,410 |
| 2007 | 8,159 | 6,815 | 7,023 | 7,451 | 7,637 | 7,441 | 8,611 | 8,566 | 8,410 | 7,923 | 7,263 | 8,223 |
| 2008 | 7,308 | 5,936 | 6,419 | 6,874 | 6,231 | 6,099 | 6,211 | 6,739 | 6,075 | 6,047 | 5,630 | 5,801 |
| 2009 | 6,264 | 5,396 | 6,134 | 5,812 | 5,590 | 7,062 | 7,302 | 7,170 | 6,094 | 4,848 | 5,470 | 5,402 |
| 2010 | 4,814 | 4,346 | 5,053 | 6,197 | 6,428 | 4,309 | 4,789 | 5,921 | 4,856 | 4,484 | 4,478 | 4,479 |
| 2011 | 2,940 | 2,407 | 3,709 | 4,041 | 4,289 | 4,236 | 3,756 | 4,304 | 3,377 | 3,775 | 3,838 | 2,829 |
| 2012 | 3,779 | 2,597 | 2,600 | 2,848 | 2,467 | 2,932 | 2,888 | 2,633 | 2,399 | 1,549 | 1,052 | 2,453 |
| 2013 | 3,152 | 2,437 | 2,818 | 3,350 | 3,628 | 4,149 | 4,091 | 4,033 | 3,664 | 2,618 | 2,953 | 3,949 |
| 2014 | 2,986 | 2,108 | 2,516 | 2,871 | 1,207 | 1,224 | 1,616 | 1,439 | 1,064 | 1,095 | 1,340 | 1,098 |
| 2015 | 1,474 | 1,253 | 1,287 | 1,055 | 1,151 | 1,210 | 1,264 | 1,404 | 1,367 | 1,187 | 1,369 | 1,046 |
| 2016 | 1,291 | 1,117 | 1,411 | 1,077 | 1,309 | 1,186 | 1,405 | 1,407 | 1,269 | 1,437 | 1,004 | 1,329 |
| 2017 | 1,116 | 765 | 1,115 | 1,118 | 951 | 1,080 | 1,166 | 997 | 1,130 | 957 | 978 | 1,175 |
| 2018 | 1,201 | 851 | 838 | 843 | 994 | 1,042 | 981 | 883 | 750 | 685 | 871 | 919 |
| 2019 | 81 | 32 | 42 | -121 | 142 | 223 | 38 | 35 | 97 | -18 | -11 | 180 |
| 2020 | -12 | -43 | 207 | -32 | 323 | 334 | 404 | 320 | 374 | 305 | 244 | 106 |
| 2021 | 174 | -76 | 142 | 92 | 193 | 215 | 391 | 498 | 391 | 335 | 566 | 404 |
| 2022 | 371 | 250 | 359 | 215 | 302 | 284 | 410 | 326 | 217 | 190 | 76 | 29 |
| 2023 | 177 | 125 | 258 | 253 | 350 | 368 | 512 | 419 | 446 | 235 | 134 | 347 |
| 2024 | 337 | |||||||||||
| - = No Data Reported; -- = Not Applicable; NA = Not Available; W = Withheld to avoid disclosure of individual company data. |
| Release Date: 3/29/2024 |
| Next Release Date: 4/30/2024 |