|
Download Data (XLS File) |
|
||||||||
|
||||||||
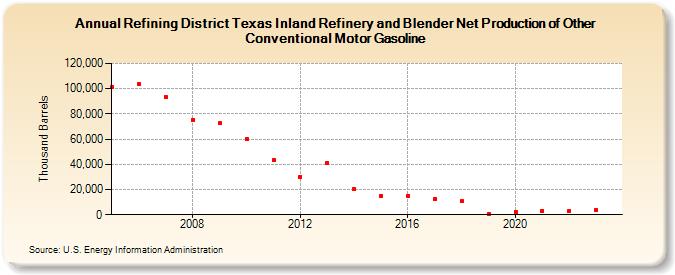
| Refining District Texas Inland Refinery and Blender Net Production of Other Conventional Motor Gasoline (Thousand Barrels) | ||||||||
| Decade | Year-0 | Year-1 | Year-2 | Year-3 | Year-4 | Year-5 | Year-6 | Year-7 | Year-8 | Year-9 |
|---|---|---|---|---|---|---|---|---|---|---|
| 2000's | 101,248 | 103,343 | 93,522 | 75,370 | 72,544 | |||||
| 2010's | 60,154 | 43,501 | 30,197 | 40,842 | 20,564 | 15,067 | 15,242 | 12,548 | 10,858 | 720 |
| 2020's | 2,530 | 3,325 | 3,029 | 3,624 |
| - = No Data Reported; -- = Not Applicable; NA = Not Available; W = Withheld to avoid disclosure of individual company data. |
| Release Date: 3/29/2024 |
| Next Release Date: 8/30/2024 |