|
Download Data (XLS File) |
|
||||||||
|
||||||||
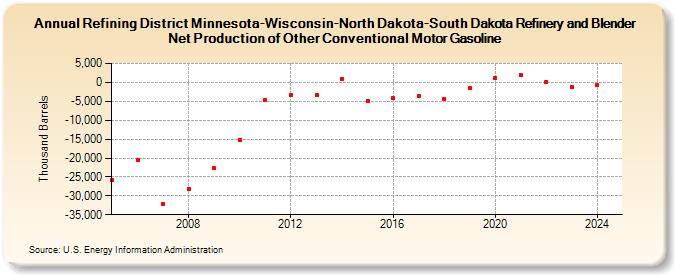
| Refining District Minnesota-Wisconsin-North Dakota-South Dakota Refinery and Blender Net Production of Other Conventional Motor Gasoline (Thousand Barrels) | ||||||||
| Decade | Year-0 | Year-1 | Year-2 | Year-3 | Year-4 | Year-5 | Year-6 | Year-7 | Year-8 | Year-9 |
|---|---|---|---|---|---|---|---|---|---|---|
| 2000's | -25,741 | -20,656 | -32,156 | -28,149 | -22,773 | |||||
| 2010's | -15,124 | -4,764 | -3,409 | -3,250 | 953 | -4,935 | -4,193 | -3,716 | -4,276 | -1,611 |
| 2020's | 1,176 | 2,045 | 139 | -1,206 |
| - = No Data Reported; -- = Not Applicable; NA = Not Available; W = Withheld to avoid disclosure of individual company data. |
| Release Date: 4/30/2024 |
| Next Release Date: 8/30/2024 |