|
Download Data (XLS File) |
|
||||||||
|
||||||||
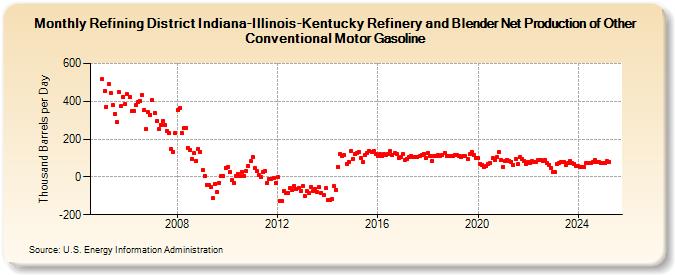
| Refining District Indiana-Illinois-Kentucky Refinery and Blender Net Production of Other Conventional Motor Gasoline (Thousand Barrels per Day) | ||||||||
| Year | Jan | Feb | Mar | Apr | May | Jun | Jul | Aug | Sep | Oct | Nov | Dec |
|---|---|---|---|---|---|---|---|---|---|---|---|---|
| 2005 | 516 | 453 | 372 | 489 | 443 | 379 | 333 | 288 | 448 | 376 | 424 | 385 |
| 2006 | 437 | 423 | 348 | 351 | 378 | 395 | 404 | 432 | 355 | 254 | 342 | 329 |
| 2007 | 406 | 339 | 295 | 252 | 276 | 296 | 276 | 244 | 230 | 148 | 131 | 233 |
| 2008 | 353 | 363 | 234 | 258 | 261 | 155 | 143 | 96 | 125 | 86 | 148 | 134 |
| 2009 | 36 | 5 | -42 | -45 | -55 | -113 | -35 | -81 | -30 | 3 | 5 | 49 |
| 2010 | 53 | 28 | -16 | -31 | 3 | 16 | 7 | 25 | 6 | 31 | 60 | 82 |
| 2011 | 103 | 47 | 29 | 8 | -2 | 25 | 31 | -34 | -9 | -10 | -6 | -33 |
| 2012 | 0 | -125 | -126 | -76 | -83 | -85 | -61 | -71 | -46 | -65 | -60 | -72 |
| 2013 | -49 | -103 | -76 | -86 | -51 | -73 | -63 | -81 | -56 | -85 | -95 | -60 |
| 2014 | -121 | -122 | -118 | -50 | -67 | 55 | 121 | 113 | 115 | 67 | 81 | 136 |
| 2015 | 93 | 121 | 127 | 132 | 100 | 77 | 114 | 129 | 136 | 134 | 136 | 122 |
| 2016 | 112 | 120 | 110 | 121 | 116 | 122 | 135 | 117 | 124 | 120 | 100 | 106 |
| 2017 | 120 | 88 | 95 | 104 | 112 | 105 | 103 | 103 | 108 | 116 | 123 | 101 |
| 2018 | 129 | 112 | 86 | 110 | 108 | 114 | 112 | 114 | 128 | 109 | 109 | 108 |
| 2019 | 110 | 118 | 114 | 112 | 105 | 110 | 109 | 93 | 119 | 131 | 116 | 99 |
| 2020 | 101 | 70 | 65 | 50 | 56 | 70 | 75 | 98 | 87 | 105 | 130 | 88 |
| 2021 | 55 | 86 | 92 | 85 | 81 | 64 | 96 | 68 | 103 | 96 | 86 | 66 |
| 2022 | 79 | 74 | 82 | 79 | 81 | 90 | 88 | 82 | 90 | 76 | 65 | 48 |
| 2023 | 25 | 24 | 67 | 74 | 78 | 78 | 62 | 71 | 84 | 72 | 70 | 57 |
| 2024 | 59 | |||||||||||
| - = No Data Reported; -- = Not Applicable; NA = Not Available; W = Withheld to avoid disclosure of individual company data. |
| Release Date: 3/29/2024 |
| Next Release Date: 4/30/2024 |